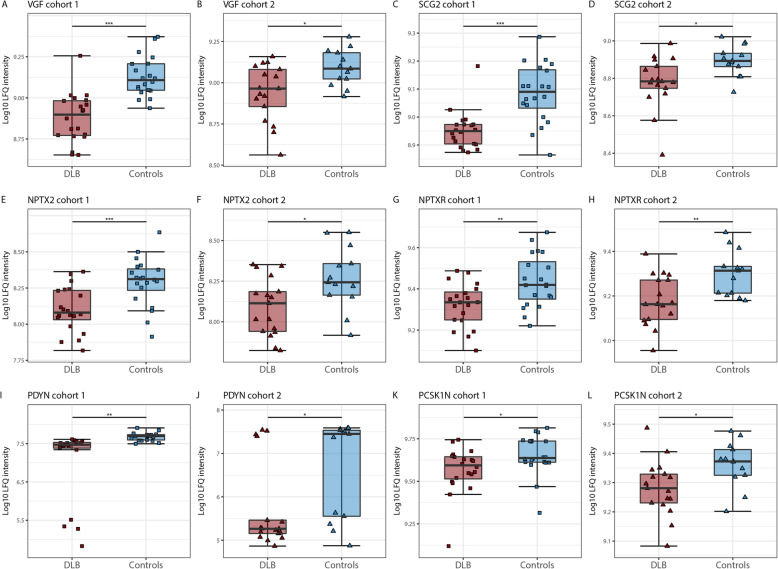
Fig. 3.
Box and Whisker plots of candidate CSF biomarkers for DLB. a Log 10 LFQ intensity of VGF in cohort 1, b VGF in cohort 2, c, d SCG, e, f NPTX2, g, h NPTXR, i, j PDYN, k, l PCSK1N. The line through the middle of the boxes corresponds to the median and the lower and the upper lines to the 25th and 75th percentile, respectively. The whiskers extend from the 5th percentile on the bottom to the 95th percentile on top. Differences between DLB patients and controls were assessed limma package available from the Bioconductor package, * p < 0.05, ** p < 0.01, *** p < 0.001. Abbreviations: DLB, Dementia with Lewy bodies; NPTX2, Neuronal pentraxin 2; NPTXR, Neuronal pentraxin receptor, PCSK1N, ProSAAS; PDYN, Proenkephalin-B; SCG2, Secretogranin-2; VGF, Neurosecretory protein

