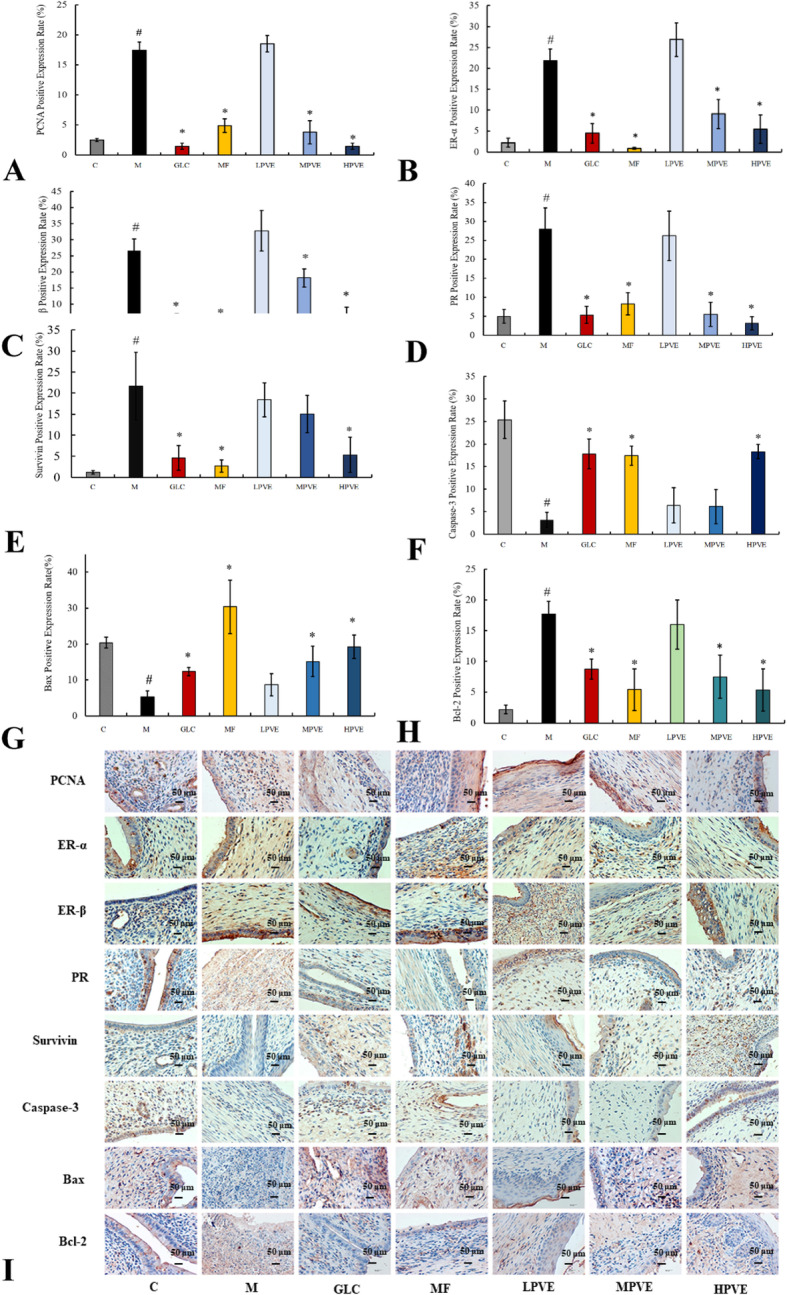
Fig. 6.

Effects of PVE on positive expression levels of PCNA, ER-α, ER-β, PR, Survivin, Caspase-3, Bax and Bcl-2. The groups are shown as follows: control (C); model (M); GLC positive control group (GLC, 0.30 g/kg); mifepristone positive control group (MF, 5.4 mg/kg); low-dose PVE (LPVE, 0.11 g/kg); medium-dose PVE (MPVE, 0.22 g/kg); high-dose PVE (HPVE, 0.44 g/kg). a-h: positive expression rate of PCNA, ER-α, ER-β, PR, Survivin, Caspase-3, Bax, and Bcl-2 in the uterus tissue under PVE treatment by IHC; Compared with the control group, #P < 0.05; Compared with the model group, *p < 0.05; i: IHC images of PCNA, ER-α, ER-β, PR, Survivin, Caspase-3, Bax, and Bcl-2 in the uterus tissue under PVE treatment by IHC, × 400 magnification, scale bar:50 μm)
