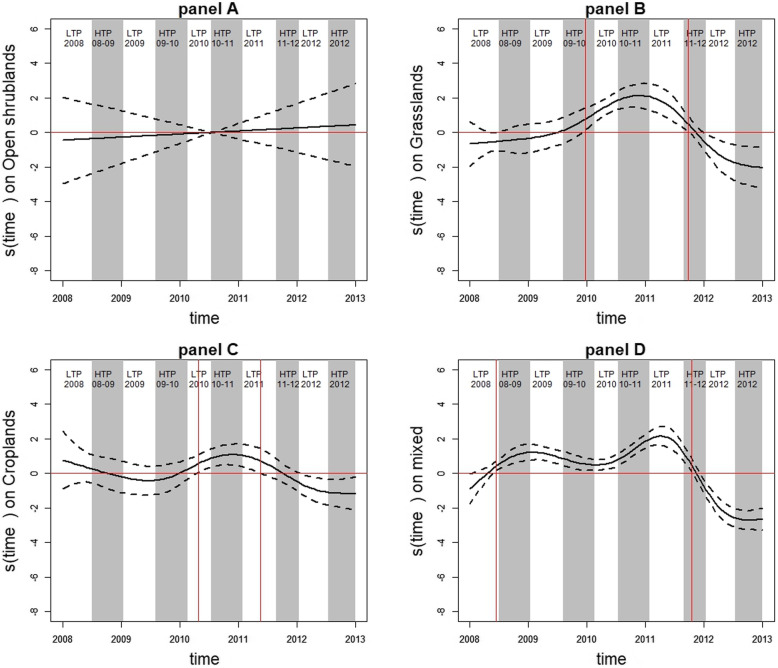
Fig. 3.
Temporal evolution of the risk of being hotspot with 95%CI according to vegetation type. Temporal evolution of the risk of being a hotspot (continuous black curve) with 95% confidence interval (discontinuous black curves) according to each vegetation type: open shrublands (panel a), grasslands (panel b), croplands (panel c), and mixed vegetation (panel d). HTPs and LTPs are indicated in grey and white, respectively. The vertical red lines indicate the dates of interest, at which villages were at risk of being hotspot. The horizontal red lines indicate the zero reference line

