Fig. 4.
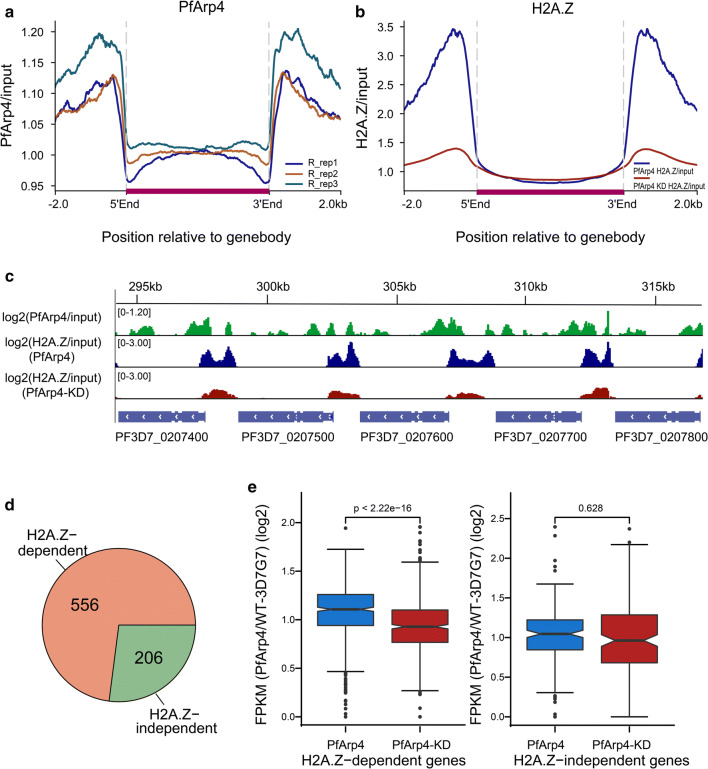
PfArp4 regulated H2A.Z deposition in eukaryotic intergenic regions in the genome. a Average profile of PfArp4 enrichment at ring stagerelative to genebody for all genes by three ChIP-seq replications.The data are shown as read coverage of PfArp4 ChIP value normalized with input. b Average profile of H2A.Z enrichment at ring stage (H2A.Z ChIP-normalized read coverage/input-normalized read coverage) relative to genebody for all genes of upon PfArp4 knockdown. c Normalized read coverage plot of reads mapped to a region of chromosome 2 highlighting H2A.Z is colocalized with PfArp4 and reduced upon PfArp4 knockdown. d Pie chart showing the composition of PfArp4-enriched genes with regard to the existence of H2A.Z in genespromoters. e Boxplot showing the H2A.Z-dependent genes are significantly downregulated after PfArp4 knockdown (left) while the H2A.Z-independent genes are not (right). Wilcoxon signed-rank test, Z = − 8.381; P-value < 2.2e-16 (left); Wilcoxon signed-rank test, Z = − 0.484, P = 0.628 (right)

