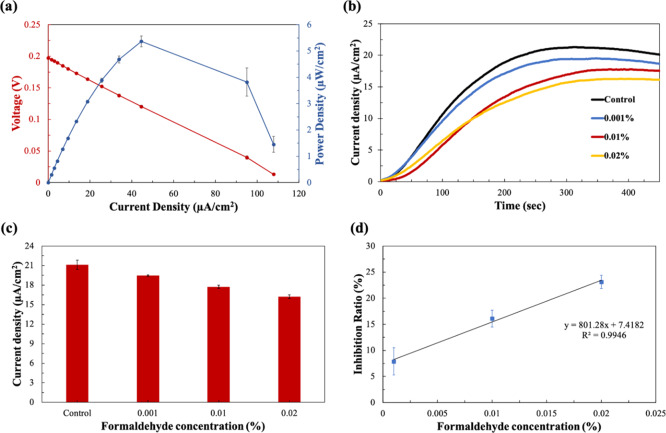
Figure 4.
(a) Polarization curve and power output of the MFC sensor calculated from the saturated current outputs at different external resistors; (b) current responses to the formaldehyde solutions as a function of time under 10 kΩ; (c) current densities of different formaldehyde solutions at 6 min; and (d) calibration curve of the MFC sensor showing IR (%) versus formaldehyde concentration (%).

