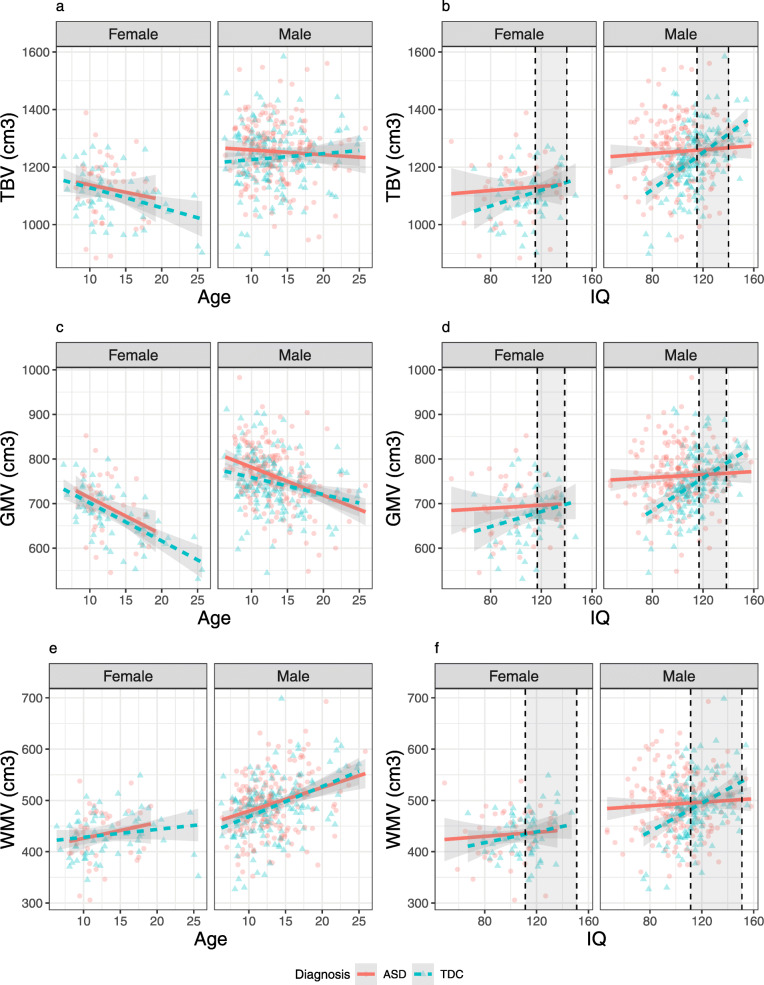
Fig. 2.
Relationships of IQ and age with total brain volume (a, b), gray matter volume (c, d), and white matter volume (e, f) in the primary sample, by diagnosis and sex. IQ shows a significant interaction with diagnosis predicting all three outcome measures (b, d, e). Age did not significantly predict TBV (a), negatively predicted GMV (c), and positively predicted WMV (e). Significant main effects of diagnosis and sex were observed in all 3 measures. Dashed lines indicate regions-of-significance, where the effect of diagnosis is not significant within the shaded region

