Abstract
Non-contrast CT (NCCT) is widely employed as the first-line imaging test to evaluate intracranial hemorrhage (ICH). Advances in mutidetector CT (MDCT) technology have greatly improved the image quality of NCCT for the detection of established, relatively large, and acute ICHs. Meanwhile, the reliability of MDCT in detecting microbleeds and chronic hemorrhage, and in predicting hemorrhagic transformation needs to be further improved. The purpose of this work was to investigate the potential use of non-spectral photon counting CT (PCCT) to address these challenges in ICH imaging. Towards this goal, the NCCT protocol of an experimental PCCT system that simulates the geometry of a general-purpose MDCT was optimized. The optimization was driven by three imaging tasks: detection of a 4.0 mm intraparenchymal hemorrhage, detection of a 1.5 mm subarachnoid hemorrhage, and discrimination of a sulcus in the insular cortex from the parenchymal background. These imaging tasks were custom-built into an anthropomorphic head phantom. Under the guidance of the frequency-dependent noise equivalent quanta and the ideal observer model detectability index d′, the optimal PCD detection mode, energy threshold, and reconstruction kernel were found to be the anti-charge sharing mode, 15 keV, and an apodized ramp kernel, respectively. Compared with a clinical MDCT operated with an ICH protocol and at a matched dose level, the PCCT system provided at least 20% improvements in d′ for all three ICH imaging tasks. These results demonstrated the potential benefits of non-spectral PCCT in ICH assessment.
Keywords: photon counting CT, photon counting detector, non-contrast head CT, intracranial hemorrhage, task-based detectability index, ideal model observer, stroke imaging
1. Introduction
Intracranial hemorrhage (ICH) refers to bleeding inside the cranium. It can be classified into four subtypes, including intracerebral, subarachnoid, subdural, and epidural hemorrhage (Naidich et al 2012). Any of these subtypes of ICH is a medical emergency. For a patient with ICH-like symptoms, immediate medical service needs to be provided to determine the location, subtype, and possible cause of bleeding, so that the appropriate medical treatment can be initiated. Common causes of ICH include physical trauma (Perel et al 2009), blood-thinning medication (FDA 2012, Ferreira da Silva and Provencio 2015), ruptured aneurysm (Brandt et al 1987, Nowak et al 1998), and those factors associated with hemorrhagic strokes (Boccardi et al 2017). Some non-hemorrhagic strokes (e.g. acute ischemic strokes) may eventually transform into ICH, particularly after revascularization treatment (Sussman and Connolly 2013). When a hemorrhagic transformation occurs, the clinical outcome of the revascularization treatment is usually poor (Fiorelli et al 1999, Nogueira et al 2015). Therefore, a typical clinical stroke workup needs to assess not only established ICH but also the risk of hemorrhagic transformation (Gonzalez et al 2011).
Multidetector CT (MDCT) plays an important role in the clinical assessment of ICH. The American College of Radiology (ACR) recommends ‘the initial imaging study in patients presenting with suspected nontraumatic ICH, whether SAH (subarachnoid hemorrhage) or intraparenchymal hemorrhage, should be noncontrast head CT’ (ACR 2016). ACR also recommends noncontrast CT (NCCT) to be ‘the first-line imaging test to evaluate for ICH in patients presenting with acute stroke, whether acute ischemic stroke or hemorrhagic stroke’ (ACR 2016). Established ICHs often manifest as hyper-attenuating foci in NCCT images. The contrasts of these foci relative to the brain parenchyma are often very low, since the CT number of pure blood ranges between 60 and 100 HU, and the CT number of normal gray matter is about 30–35 HU. A small amount of hemorrhage may have a hematocrit value of 27% of pure whole blood, which further decreases the contrast between ICH and brain parenchyma (Gonzalez et al 2011). Another common image feature associated with established ICH is the midline shift. For the prediction of hemorrhagic transformation in stroke patients, identifying large hypo-attenuating foci, loss of gray-white matter differentiation in the insular cortex (aka the insular ribbon), and effacement of sulci is valuable (Gonzalez et al 2011). In addition, several other CT image features often need to be considered when assessing ICH: first, true ICH needs to be differentiated from hemorrhage-mimics such as intraventricular calcifications (Chen et al 2014). Second, confounding factors associated with CT artifacts (e.g. beam hardening artifacts at the posterior fossa, partial volume artifacts near the skull) should be minimized. Third, microbleeding needs to be considered, since thrombolytic treatment may cause a transformation of sub-clinical microbleeding into symptomatic ICH (Hart et al 1995).
These ICH imaging tasks summarized above enforce strict requirements on CT image quality: for the detection of relatively large hyper- and hypo-attenuating foci in the parenchyma, low noise is highly desirable due to the limited image contrast; the detection of microbleeds, sulci effacement, and midline shift requires both excellent spatial resolution and low noise; the detection of bleed near the posterior fossa and the differentiation of calcifications and skull from ICH require CT artifacts to be effectively suppressed (Gonzalez et al 2011).
The current MDCT technology is capable of meeting the low noise requirement of ICH imaging by using relatively high radiation exposure, detectors with relatively high zero-frequency DQE, thick slice (e.g. 5 mm) reconstructions, iterative reconstruction algorithms with noise-suppressing priors (Kilic et al 2011, Ozdoba et al 2014, Osteras et al 2016), etc. Nevertheless, the capabilities of MDCT in detecting microbleeds and chronic ICH, in predicting hemorrhagic transformation within acute ischemic infarcts, in detecting bleeds near the skull and skull base, and in discriminating true bleeds from hemorrhage-mimics, need to be further improved (Nakada and Kwee 1996, Packard et al 2003, Kidwell et al 2004). One of the major limitations of the current MDCT technology is the highly sub-optimal detection mechanism for polychromatic x-rays: in principle, the detected low energy photons that carry richer contrast information should be preferentially weighted (Tapiovaara and Wagner 1985, Sandborg and Carlsson 1992, Giersch et al 2004). In reality, low energy photons receive less weightings from the energy-integrating detector (EID) used in MDCT (Tapiovaara and Wagner 1985, Giersch et al 2004). This highly sub-optimal photon weighting scheme has been degrading the contrast-to-noise ratio (CNR) of ICH. Another technical challenge in MDCT is its limited spatial resolution: the typical physical size of a CT detector pixel is around 1 mm (Kalender 2011); further reduction in the detector pixel size usually comes with the cost of reduced geometric efficiency (Kalender 2011). The limited in-plane spatial resolution of the conventional CT detector has restricted the resolvability of MDCT for small features such as microbleeds and sulci, and the relatively wide width of each detector row (≈1 mm) may create partial volume artifacts that obscure the visualization of bleeds in the subarachnoid space (Goodenough et al 1982, Barrett and Keat 2004, Hsieh 2015, Kalisz et al 2016).
The central purpose of this work was to investigate the potential use of the photon counting CT (PCCT) technology to improve the ICH imaging performance. Unlike the scintillator-based EID, the photon counting detector (PCD) in PCCT system uses a semiconductor to directly convert each detected x-ray photon into electrical charges (Bisogni et al 1998, Campbell et al 1998). Driven by an external electric field, the electrical charges drift towards the electrodes and induce a voltage pulse. Since the pulse height is proportional to the energy transferred from the x-ray photon to the semiconductor (Knoll 2010), the energy information of the x-ray photon can be estimated by comparing the pulse height with multiple pre-selected voltage thresholds (Ballabriga et al 2007). If only a single voltage threshold is used, each pulse above this threshold will trigger one detector count. In this case, polychromatic x-ray photons make equal contributions to the PCD outputs, as long as their energies are above the threshold energy. Based on the x-ray detection mechanism used in PCD, PCCT has three attractive features that could potentially benefit ICH imaging: first, the equal energy weighting scheme in PCD could lead to super ior CNR compared with EID (Tapiovaara and Wagner 1985, Pourmorteza et al 2017); second, the direct x-ray conversion mechanism in PCD could lead to improved spatial resolution compared with EID (Leng et al 2016, Yu et al 2016, Leng et al 2017, 2018); third, the energy resolving capability of PCD could potentially be utilized to implement the optimal photon weighting scheme described in Tapiovaara and Wagner (1985), Cahn et al (1999), Giersch et al (2004), Shikhaliev (2008), Schmidt (2009), to reduce beam hardening artifacts (Yu et al 2016, Symons et al 2018), or to obtain quantitative tissue information (Roessl and Proksa 2007, Roessl et al 2011, Shikhaliev and Fritz 2011, Wang et al 2011, Schmidt et al 2017, Symons et al 2017, Ferrero et al 2018).
Indeed, the availability of spectral information is attractive for ICH imaging and other neuroimaging applications (Taguchi et al 2018). Meanwhile, the importance of the non-spectral mode of PCCT in ICH imaging should not be overlooked since non-spectral NCCT is still the gold-standard modality for ICH imaging. For PCCT, both non-spectral and spectral images can be generated from a single scan with perfect registration. However, a single scan also means the acquisition parameters cannot be chosen separately for spectral and non-spectral modes. How to wisely select these parameters is a meaningful and clinically relevant research topic. One strategy is to prioritize the optimization to guarantee the non-spectral PCCT meet or exceed the clinical ICH imaging requirements; once this goal is met, the remaining spectral mode-specific parameters will be optimized so that spectral images provide free but complementary information. This work follows this strategy and focuses on how to optimize the non-spectral mode of PCCT for ICH imaging. Specifically, this work leveraged the modern signal detection theory to optimize the lowest energy threshold of PCD, the detection mode of PCD, and the reconstruction kernel for non-spectral PCCT images. Since clinical ICH imaging encompasses a wide range of specific tasks, a single task function is inadequate, and thus a total of three ICH tasks were used, representing almost the most challenging cases that could be encountered in practice: detection of a 4 mm intraparenchymal bleed with only 1% (10 HU) contrast, the detection of a 1.5 mm subarachnoid bleed with 5% contrast (50 HU), and discrimination of a sulcus from uniform parenchymal background. After the optimization process, PCCT images were compared with gold-standard MDCT images to evaluate the potential benefits of PCCT in ICH imaging.
2. Material and methods
2.1. Experimental PCCT system
A PCCT benchtop system shown in figure 1 was constructed using the following major components: a PCD (XC-Hydra FX50, Xcounter AB, Sweden), a rotating-anode diagnostic x-ray tube (G1952 with B-180H housing, Varian Medical Systems, Inc. Salt Lake City, UT), an 80 kW high frequency generator (Indico100, CPI Inc., Ontario, Canada), an x-ray collimator, a copper beam filter (0.2 mm), and a motorized rotary stage. The system geometry was configured such that the source-to-detector distance (95 cm) and source-to-object distance (54 cm) match those of a clinical MDCT scanner used in this work. Note that the benchtop system was developed to simulate a general purpose CT instead of a dedicated head CT scanner. Our optimization only involves acquisition and reconstruction parameters that can be adjusted for other CT applications.
Figure 1.
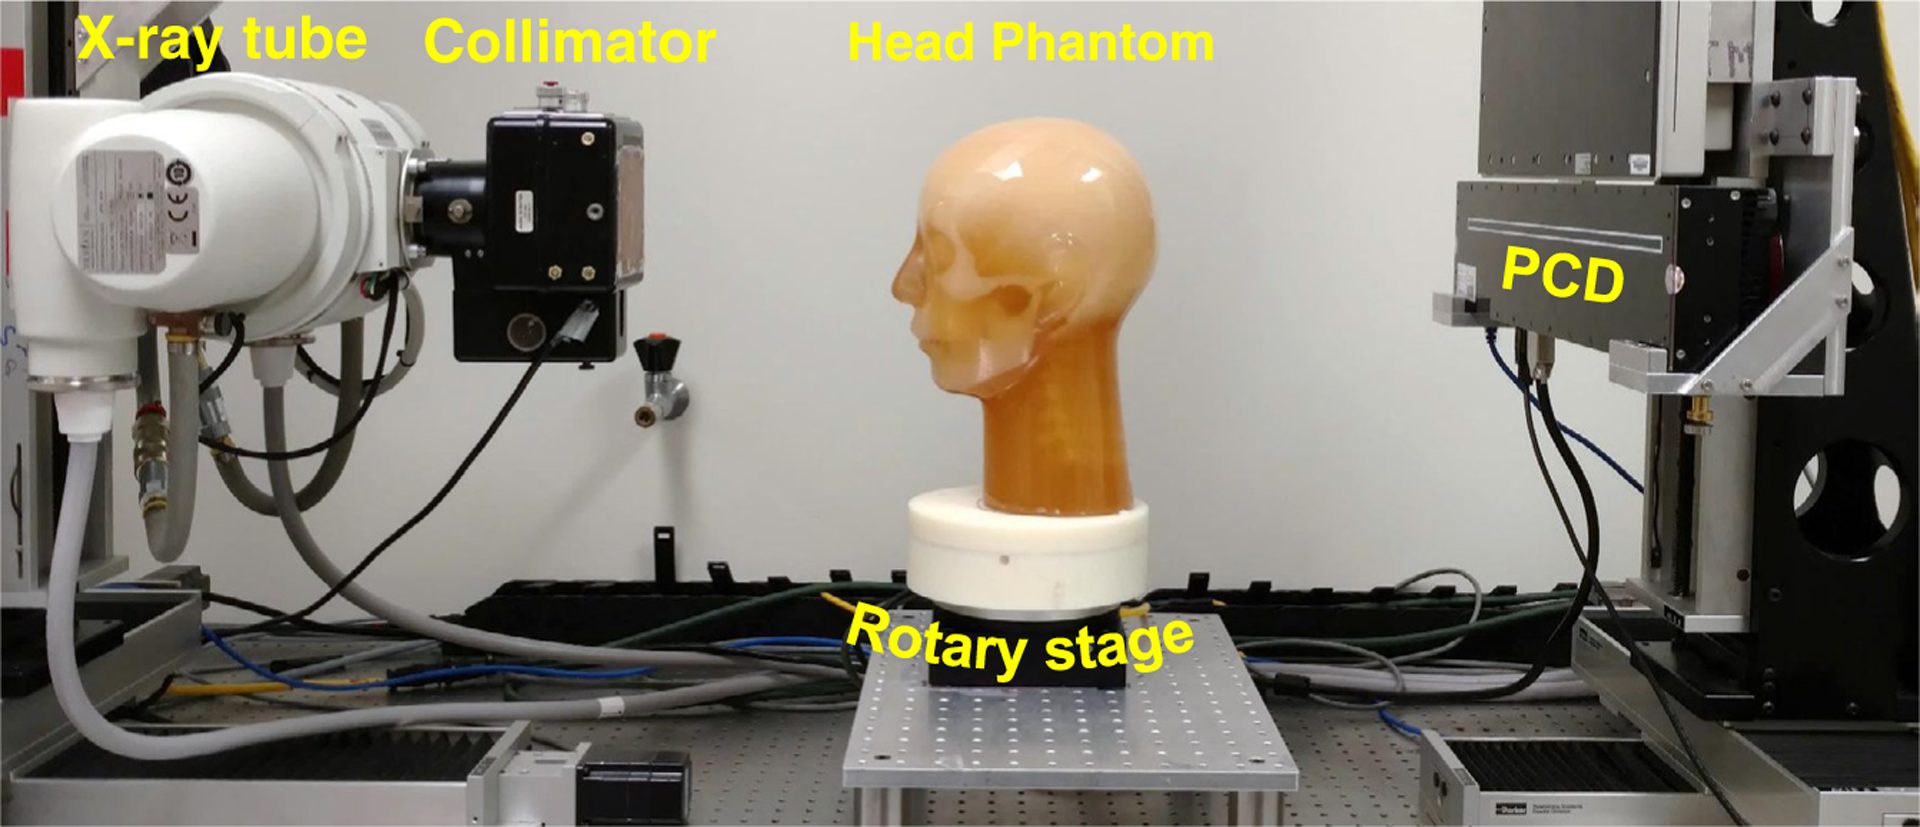
The PCCT benchtop system used in this work.
The PCD used in the benchtop system is composed of 20 cadmium telluride (CdTe) panels, which provide a total sensitive area of 51.2 cm (width) × 0.6 cm (height) and 5120 × 64 px, each with a size of 100 × 100 μm2. The PCD provides two adjustable energy thresholds. The 0.75 mm-thick CdTe sensor provides ⩾93% x-ray absorption efficiency for the x-ray beam used in this work, even when the beam is hardened by the head phantom. Other parameters of this PCD can be found in table 1.
Table 1.
Parameters of the PCD.
| Conversion type | Direct |
|---|---|
| Conversion material | CdTe |
| CdTe thickness (mm) | 0.75 |
| Active detector area (cm × cm) | 51.2 × 0.6 |
| Pixel size (μm) | 100 |
| Max. frame rate (fps) | 150 |
| Bit depth | 12 |
| Fill factor | 100% |
| Operation temperature (°C) | 15–35 |
| Energy range (keV) | 20–160 |
The PCD offers three detection modes: high flux, single pixel, and anti-charge sharing (ACS) mode (aka anti-coincidence or charge summing mode). According to the information provided by the manufacturer, the high flux mode is able to work under a flux up to 5 × 10⁸ photons/mm2/s, but with the cost of much poorer energy resolution and lower detection sensitivity. The ACS mode involves inter-pixel communication and reassignment of shared charges. It provides better energy resolution, but with the cost of longer detector dead time. The single pixel mode does not use inter-pixel communication to correct the charge sharing effect. As stated by the manufacturer, its dead time is in between the high flux mode and the ACS mode. However, it was unclear how other aspects of the detector performance (e.g. spatial resolution, frequency-dependent DQE) vary across these modes, and which mode should be used for ICH imaging. Therefore, one of the major research tasks in this work was to identify the optimal detection mode. Another task was to optimize the low energy threshold for the PCD: if the threshold is set too high, the input x-rays are more likely to be rejected, which may decrease the DQE of the PCD (Ji et al 2018); on the other hand, if the threshold is set too low, the undesirable electronic noise and the charge sharing effect may not be effectively rejected (Marchal 2010, Xu et al 2014, Hamann et al 2015). In this work, the optimal threshold was determined as the one that maximizes the PCCT performance for the ICH imaging tasks described in the following subsection.
2.2. ICH imaging task models
In clinical practice, there is usually very limited prior information about the location, size, and subtype of the ICH in individual patients. Therefore, an ICH imaging system should accommodate all relevant imaging tasks and meet the image quality requirement of each task. In other words, an ICH imaging system optimized for a narrow range of ICH tasks but failing to meet the requirements of other ICH tasks is undesirable. In designing the ICH imaging task models, our rationale was to use the most challenging ICH tasks for which the current MDCT technology often provides inadequate performance. Meanwhile, other less challenging ICH tasks were also used as additional references, such that one can evaluate whether the developed system meet all of the image quality requirements.
Based on this rationale, this work used three representative ICH imaging tasks that are considered challenging for the current MDCT technology. As shown in figure 2, the first task is the detection of an intraparenchymal hemorrhage that is small (4 mm) and of low contrast (1% difference in attenuation coefficient relative to water, or 10 HU). This task model simulates a very low contrast microbleed. The second imaging task is the detection of a small (1.5 mm) bleed in the subarachnoid space near the vertex (contrast =50 HU). This task is challenging because it is not only small but also very sensitive to partial volume artifacts (Goodenough et al 1982). The third imaging task is the discrimination of a sulcus in the insular cortex from the neighboring brain tissue. The contrast between the brain tissue and the cerebrospinal fluid (CSF) is only 25 HU. This task was chosen because of its clinical relevance for the assessment of hemorrhagic transformation risk.
Figure 2.
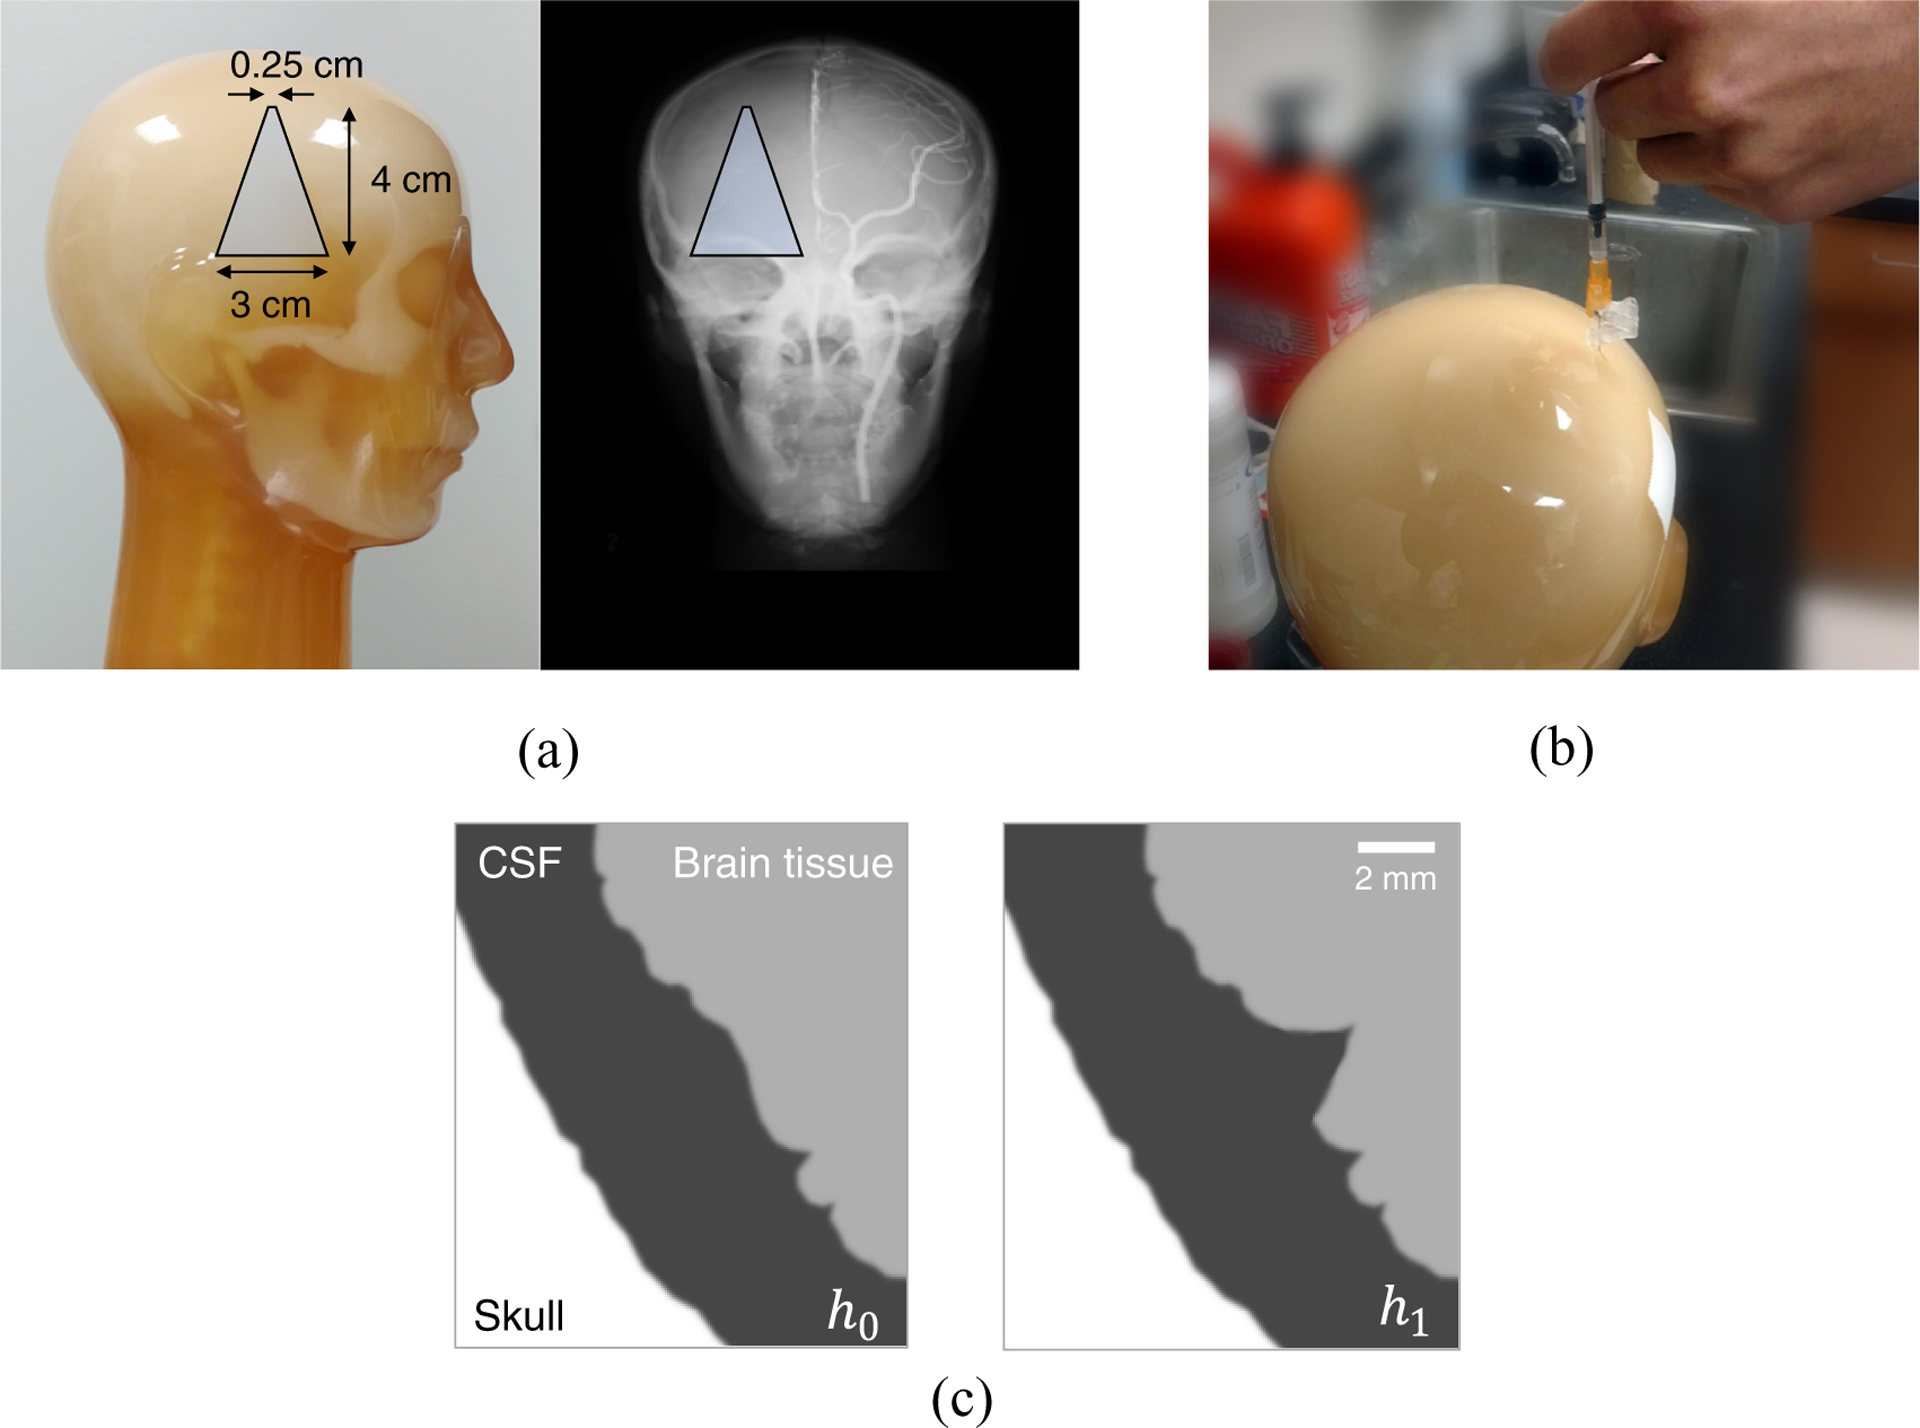
(a) The trapezoid illustrates the intraparenchymal hemorrhage model built into the right hemisphere of the anthropomorphic head phantom. (b) A subarachnoid hemorrhage model was built by drilling a 1.5 mm hole into the subarachnoid space of the head phantom and subsequent filling of blood-simulating liquid. (c) An illustration of the sulcus discrimination task where the null hypothesis (h0) and the alternative hypothesis (h1) are shown.
Despite the fact that the detection of relatively large intraparenchymal bleeds is less challenging, the PCCT system still needs to be evaluated for large bleed-related tasks due to their strong clinical relevance. By incorporating all of these design considerations, an anthropomorphic head phantom (ACS CT Head, Kyoto Kagaku Co., LTD, Japan) was customized as follows: first, we collaborated with the phantom manufacturer to custom-build a tapered cylindrical intraparenchymal hemorrhage model in the phantom (figure 2(a)). The tapper design allows this model to simulate bleeds with a wide range of diameters, ranging from 2.5 to 30 mm. The nominal contrast of this object, relative to the surrounding brain tissue, is only 10 HU. Next, we opened a 1.5 mm-diameter cavity in the subarachnoid space near the vertex, then filled the cavity with a blood-simulating liquid (figure 2(b)). By doing so, we created the desired subarachnoid hemorrhage model. This anthropomorphic head phantom also contains many sulci, including those in the Sylvian Fissure. Therefore, a single phantom provides all the needed task models for the proposed optimization.
Since the original version of this Kyoto Kagaku head phantom was designed for CT angiography imaging, one hemisphere (left) of the brain contains models of contrast-enhanced cerebral arteries. However, the other hemisphere (right) is non-enhanced, and all of the tasks were built in the right hemisphere of the phantom (figure 2).
2.3. Reference MDCT image acquisition
Before acquiring PCCT images of the head phantom, the same phantom was scanned by a diagnostic MDCT system (Discovery CT750 HD, GE Healthcare) with a clinical NCCT protocol. This acquisition provided the gold-standard images that were used to benchmark the performance of the PCCT system for the same set of imaging tasks. In addition, by going through the MDCT image acquisition process, the needed information about the radiation dose level of a clinical NCCT exam was obtained. As shown by the MDCT protocol in table 2, the CTDIvol of the MDCT scan was 48 mGy. This number served as the target radiation dose level for the PCCT image acquisition.
Table 2.
Non-contrast head CT protocols used by the MDCT and PCCT systems.
| Parameter | MDCT | PCCT | |
|---|---|---|---|
| Source-to-detector distance (cm) | 94.7 | ||
| Source-to-iso distance (cm) | 53.9 | ||
| System magnification | 1.76 | ||
| Collimation at iso (cm) | 2 | ||
| CT scan mode | Axial | ||
| kV | 80 | ||
| mAs | 680 | 700 | |
| Rotation time (s) | 1 | 50 | |
| Number of views | 984 | 1500 | |
| Nominal focal spot size (mm) | 1.2 × 1.6 | 1.2 | |
| Detector pixel size (mm2) | 1.1 × 1.1 | 0.1 × 0.1 | |
| CTDIvol (mGy) | 48 | ||
| Recon field-of-view (cm) | 22 | ||
| Recon matrix size | 512 × 512 | ||
| Recon slice thickness (mm) | 5.0 | ||
| Recon kernels | Soft | Soft-equivalent | |
| Bone plus | Kernel in equation (1) |
The clinical NCCT protocol prescribes two reconstructions, one using a noise-suppressing Soft kernel for visualizing the soft tissue, and the other one using an edge-enhancing Bone Plus kernel for visualizing high frequency structures. Both reconstructions were performed at the MDCT console; according to the system manual, beam hardening corrections were automatically applied when the MDCT was operated under the Head scan mode.
Unlike the PCCT benchtop system, the z-axis of the MDCT system is parallel to the plane of the building floor. Therefore, the head phantom need to be laid down on the MDCT patient couch to achieve the same axial orientation as the one shown in figure 1. To ensure the orientation of the head phantom was precisely registered between the two CT systems, both the localizer laser beam provided by the MDCT gantry and a level were used to guide the positioning of the head phantom on the MDCT couch (figure 3).
Figure 3.
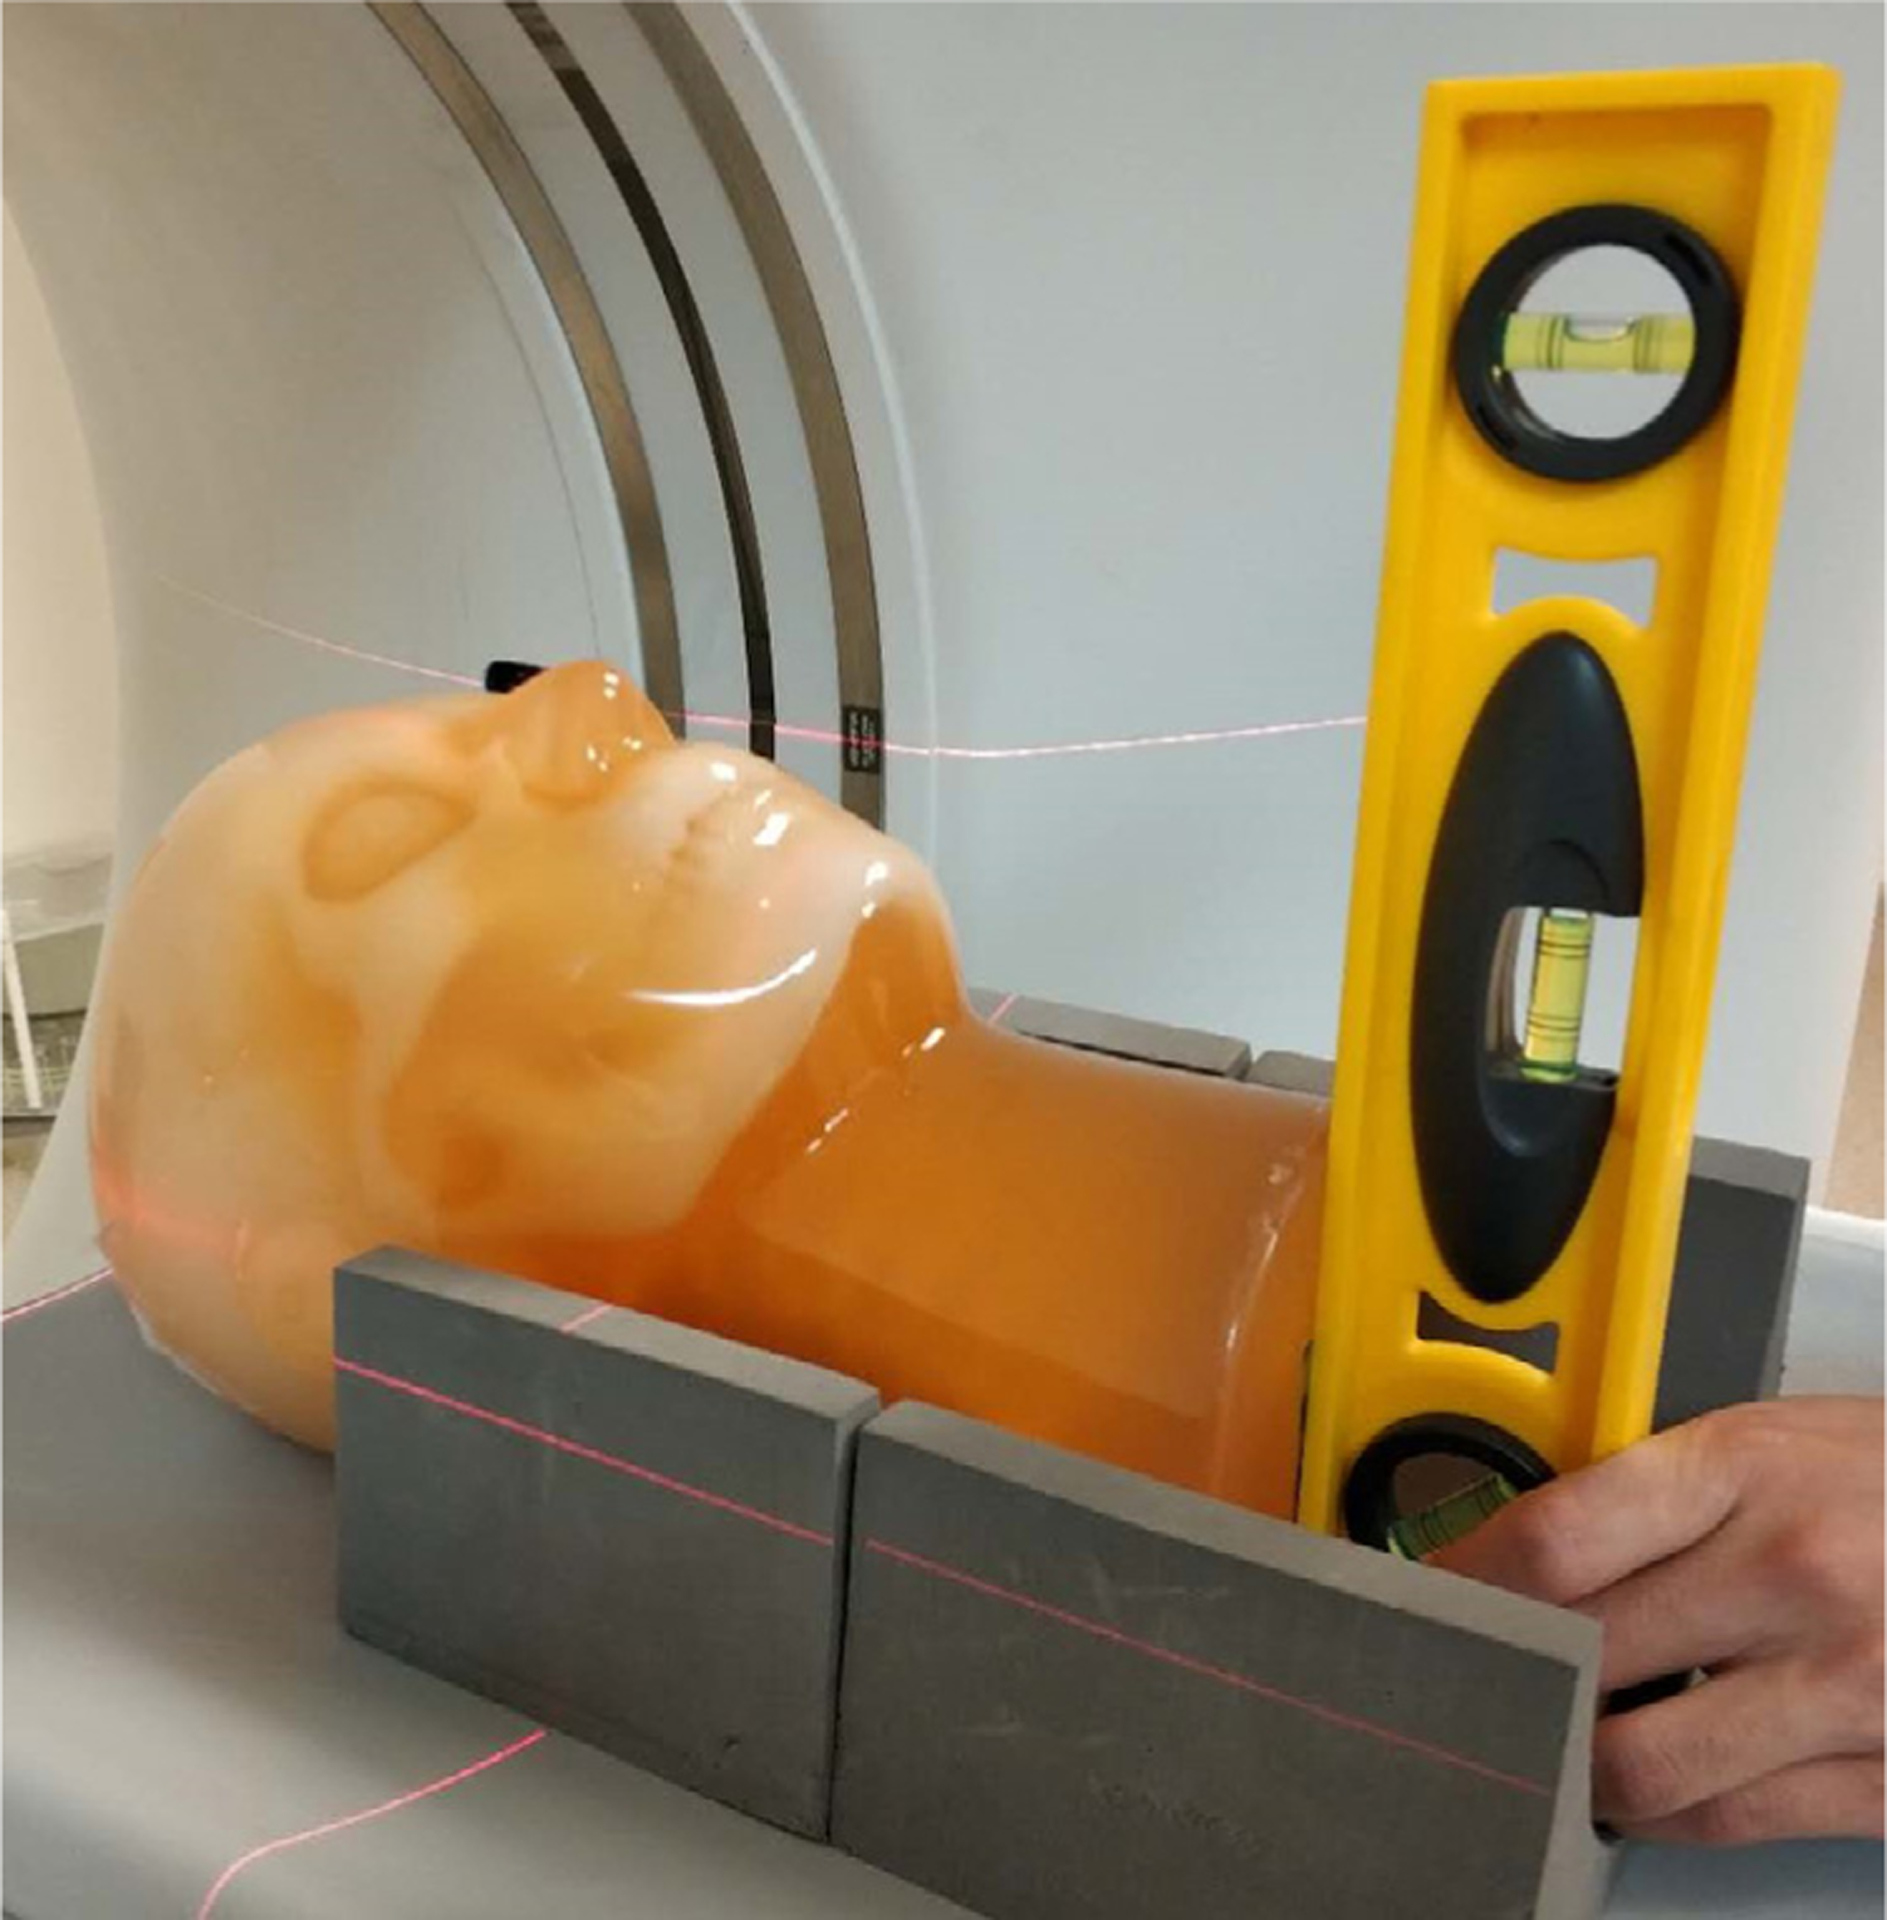
The positioning of the head phantom on the MDCT couch was guided by both the localizer laser beam from the gantry and a level, so that the bottom surface of the phantom was perpendicular to the z axis.
2.4. PCCT image acquisition and reconstruction
To match the tube potential of the reference MDCT scan, PCCT images were also acquired at 80 kV. Similarly, the beam collimation (at the iso-center) of the PCCT system was set to 20 mm, which is identical to that of the NCCT acquisition protocol used by the MDCT. Given the fact the only the MDCT is equipped with an anti-scatter grid, the PCCT system may have encountered severer scatter contamination. Analogous to the continuous exposure mode adopted by the MDCT, the PCCT acquisition was performed using the continuous fluoro mode of the angio tube. The mAs of the PCCT scan was determined based on the goal of matching the CTDIvol with that of the MDCT scans (48 mGy). For this purpose, a test PCCT scan of a 16 cm CTDI phantom was performed at 420 mAs; a 10 cm pencil ion chamber (10X6–3CT, Radcal Corp., Monrovia, CA) was used to measure the exposure levels at the center and peripheral bore of the CTDI phantom. The methodology described in AAPM Task Group 23 (2008) was used to estimate the CTDIvol from the measured exposure levels, and the estimated value for the test scan was 28.7 mGy. To match the CTDIvol of the MDCT, all subsequent PCCT scans of the head phantom were prescribed at an mAs level of 420 mAs × (48/28.7) ≈ 700 mAs. The mA was limited by the power rating of the angio tube and was restricted at 14 mA. Therefore, the scan time of each PCCT acquisition was 700 mAs ÷ 14 mA =50 s. The readout speed of the PCD was set at 30 frames per second, leading to a total of 1500 projections uniformly distributed over an angular range of 360° for each axial PCCT scan. After applying bad pixel correction, a flood field correction was performed by dividing the object-absent (i.e. air scan) projection data with the object-present projection data and then taking a logarithmic transformation.
To reduce the number of confounding factors when comparing PCCT with MDCT, the PCCT reconstruction used the conventional filtered backprojection (FBP) algorithm without any iterative reconstruction. The reconstruction field-of-view (22 cm), reconstruction matrix size (512 × 512), and reconstruction slice thickness (5 mm) matched those of MDCT. The reconstruction used the following classical apodized ramp kernel with an adjustable parameter a:
| (1) |
where k denotes spatial frequency, and kN denotes the detector Nyquist frequency. Determination of the optimal reconstruction kernel parameter a for the ICH imaging tasks was another major research aim of this work, and the corresponding method is described in the following subsection. In addition to the optimal reconstruction kernel, another linear kernel that led to the same MTF as the MDCT Soft kernel was used. The purpose of this MTF matching was to facilitate a fair comparison of the noise performance between the two CT systems when their in-plane spatial resolutions were the same.
2.5. General optimization strategy
To guide the optimization process, the ideal model observer detectability index d′ was used as the primary figure-of-merit. For a given ICH imaging task with certain hypotheses (e.g. presence or absence of a bleed), the ideal observer model uses Bayes’s theorem to combine all available information with the image data to obtain statistical estimations of the correctness of the hypotheses (Wagner and Brown 1985, Barrett et al 1993, Burgess 1999). Compared with other observer models that incorporates additional factors to model the actual human visual system, the ideal observer model focuses purely on the quality of information provided by the imaging system. This was the primary reason for choosing the ideal observer, as the work focused on the intrinsic benefits of PCCT for ICH imaging.
The square of d′ is related to the MTF and NPS of the CT system by Wagner and Brown (1985)
| (2) |
where the integration is performed within a spatial frequency space . For measurements performed with digitized image data, the boundary of is usually determined by the system Nyquist frequency. denotes the task function in the spatial frequency domain, and it is given by the Fourier transform of the difference between null h0 and alternative hypothesis h1 of the imaging task.
For a given imaging task and radiation dose level, a PCCT system parameter is considered optimal if it maximizes d′. Since three ICH imaging tasks were used, their d′ values were jointly considered when determining the optimal PCCT parameter. However, under certain special circumstances described in the next subsection, this process can be done much more efficiently.
2.6. Special case: detector optimization strategy
To expedite the optimization process that involved multiple task functions, we asked the following question: whether it is possible to find out a condition under which the optimization becomes task-independent? To help answer this question, the formula for the figure-of-merit in equation (2) was recast into the following form:
| (3) |
| (4) |
where θtot denotes the total angular range of the CT acquisition (e.g. θtot = π and 2π for half and full scan, respectively). denotes the frequency-dependent noise equivalent quanta (NEQ) of a CT system. In deriving equations (4) from (3), the following formula for was used (Hanson 1979, Tward and Siewerdsen 2008, 2009):
| (5) |
Since both the MTF and NPS of the CT system are related to the MTF and NPS of the detector used in the system, there is an intrinsic relationship between NEQCT and the NEQ of the detector (denoted as NEQdet). As shown in Tward and Siewerdsen (2008, 2009), the MTF of the CT system is related to the MTF of the detector (denoted as MTFdet) by Tward and Siewerdsen (2008, 2009), Prakash et al (2011)
| (6) |
In equation (6), we used the same notations as in Prakash et al (2011): Ti represents the transfer function associated with different sub-stages in the CT imaging chain: apodization filter (T11), window function (T12), and focal spot MTF (Tspot). Similarly, the NPS of the CT system is related to NPSdet by
| (7) |
where III denotes the comb function, Δθ denotes the angular interval for the CT acquisition, Δx and Δy denote the spatial sampling interval for the CT reconstruction, M denotes the geometric magnification of the CT system, and denotes the average output counts of the detector. In the absence of severe reconstruction-induced noise aliasing, can be written into the following simplified form up until the system Nyquist frequency (Tward and Siewerdsen 2009, Li et al 2013):
| (8) |
Based on these linear system models for CT MTF and NPS, the NEQ formula in equation (5) can be expanded as:
| (9) |
where we used the following formula for the detector NEQ:
| (10) |
and m is the total number of projection views in the CT acquisition.
For a given amount of input x-ray quanta, if a detector setting p i provides higher detector NEQ compared with another setting p j at every spatial frequency, namely
| (11) |
according to equation (9), p i also generates higher CT NEQ at every frequency level, namely
| (12) |
If this is the case, p i provides higher for any task function , because
| (13) |
In other words, if the condition in equation (11) is satisfied, detector setting p i is favored over p j for any CT imaging task. In this special case, the optimization can be carried out more efficiency by simply comparing the detector NEQs generated by different detector settings at the same exposure level.
To measure the detector NEQ, a slanted edge-based presampled MTF measurement method was used (Fujita et al 1992), and 100 repeated readouts of the PCD were performed for measuring the detector NPS. These measurements were performed at 80 kV, 14 mA, and 0.05 s per frame. The general methodology for the detector NPS and NEQ measurements follows the ICRU and AAPM recommendations (Sharp et al 1996, Samei et al 2017) and is not reiterated here. The detector NEQ was assessed at 39 different PCD conditions, including three detection modes × 13 energy threshold levels (ranging from 15 to 47 keV). If the NEQ of one specific detection mode-threshold combination enables the condition in equation (11) to be satisfied, it can be selected as the optimal detector configuration. Otherwise, the general task-driven optimization strategy in section 2.5 would be used.
2.7. Detector optimization: additional consideration
In addition to task-based detectability index and NEQ, an additional consideration in selecting the optimal PCD mode is the count loss associated with pulse pileup or the finite dead time of the PCD. If the detection mode is solely determined by the one with the lowest count loss fraction, the high flux mode is obviously the most desirable detection mode since it has the shorteset dead time. However, since the goal of the optimization was to maximize the ICH imaging performance instead of the pulse rate fidelity, the primary consideration in detection mode optimization was the detectability index. Nevertheless, pulse pileup was included as an additional constraint during the optimization since its severity can strongly influence the spectral mode. The constraint was that the selected detection mode must be able to work at a clinically relevant fluence rate with no greater than 10% count loss (Taguchi and Iwanczyk 2013). Because of the use of head bowtie filters in modern CT systems, the fluence rate (behind the head at the detector surface) in head CT imaging is usually much smaller than that of body CT imaging. As an example, when the MDCT system used in this work is operated with the clinical noncontrast head CT protocol, the fluence rate at the detector plane is on the order of 106 cps mm−2. Let’s assume the fluence rate is as high as cps mm−2. Under this condition, the expected input photon rate per PCD pixel is 7 × 10⁶ cps mm−2. Under this condition, the expected input photon rate per PCD pixel is
| (14) |
Based on the paralyzable detector model, the fraction of photon loss (ε) due to dead detector times (τ) can be estimated as follows:
| (15) |
The dead time for each of the three detection modes (high flux, single pixel, ACS) was measured using the method described in Knoll (2010), then equation (15) was used to estimate the fraction of photon loss. For each detection mode, the effect of pulse pileup was considered tolerable as long as ε ⩽ 10%.
3. Results
3.1. Optimal detector parameters
The experimentally measured NEQ(k) of the PCD system is shown in figure 4. For a given energy threshold level, the ACS mode generated higher NEQ(k) at all spatial frequencies evaluated, and the high flux mode always led to the lowest NEQ(k) among the three modes (figures 4(a) and (b)). The benefit of the ACS mode over the other two detection modes increased with higher energy threshold levels and lower spatial frequency. For example, the NEQ of ACS is 6.0% higher than that of the single pixel mode at k = 4 mm−1 and the 15 keV threshold level; this percentage increased to 75% at k = 0.5 mm−1 and the 25 keV threshold level.
Figure 4.
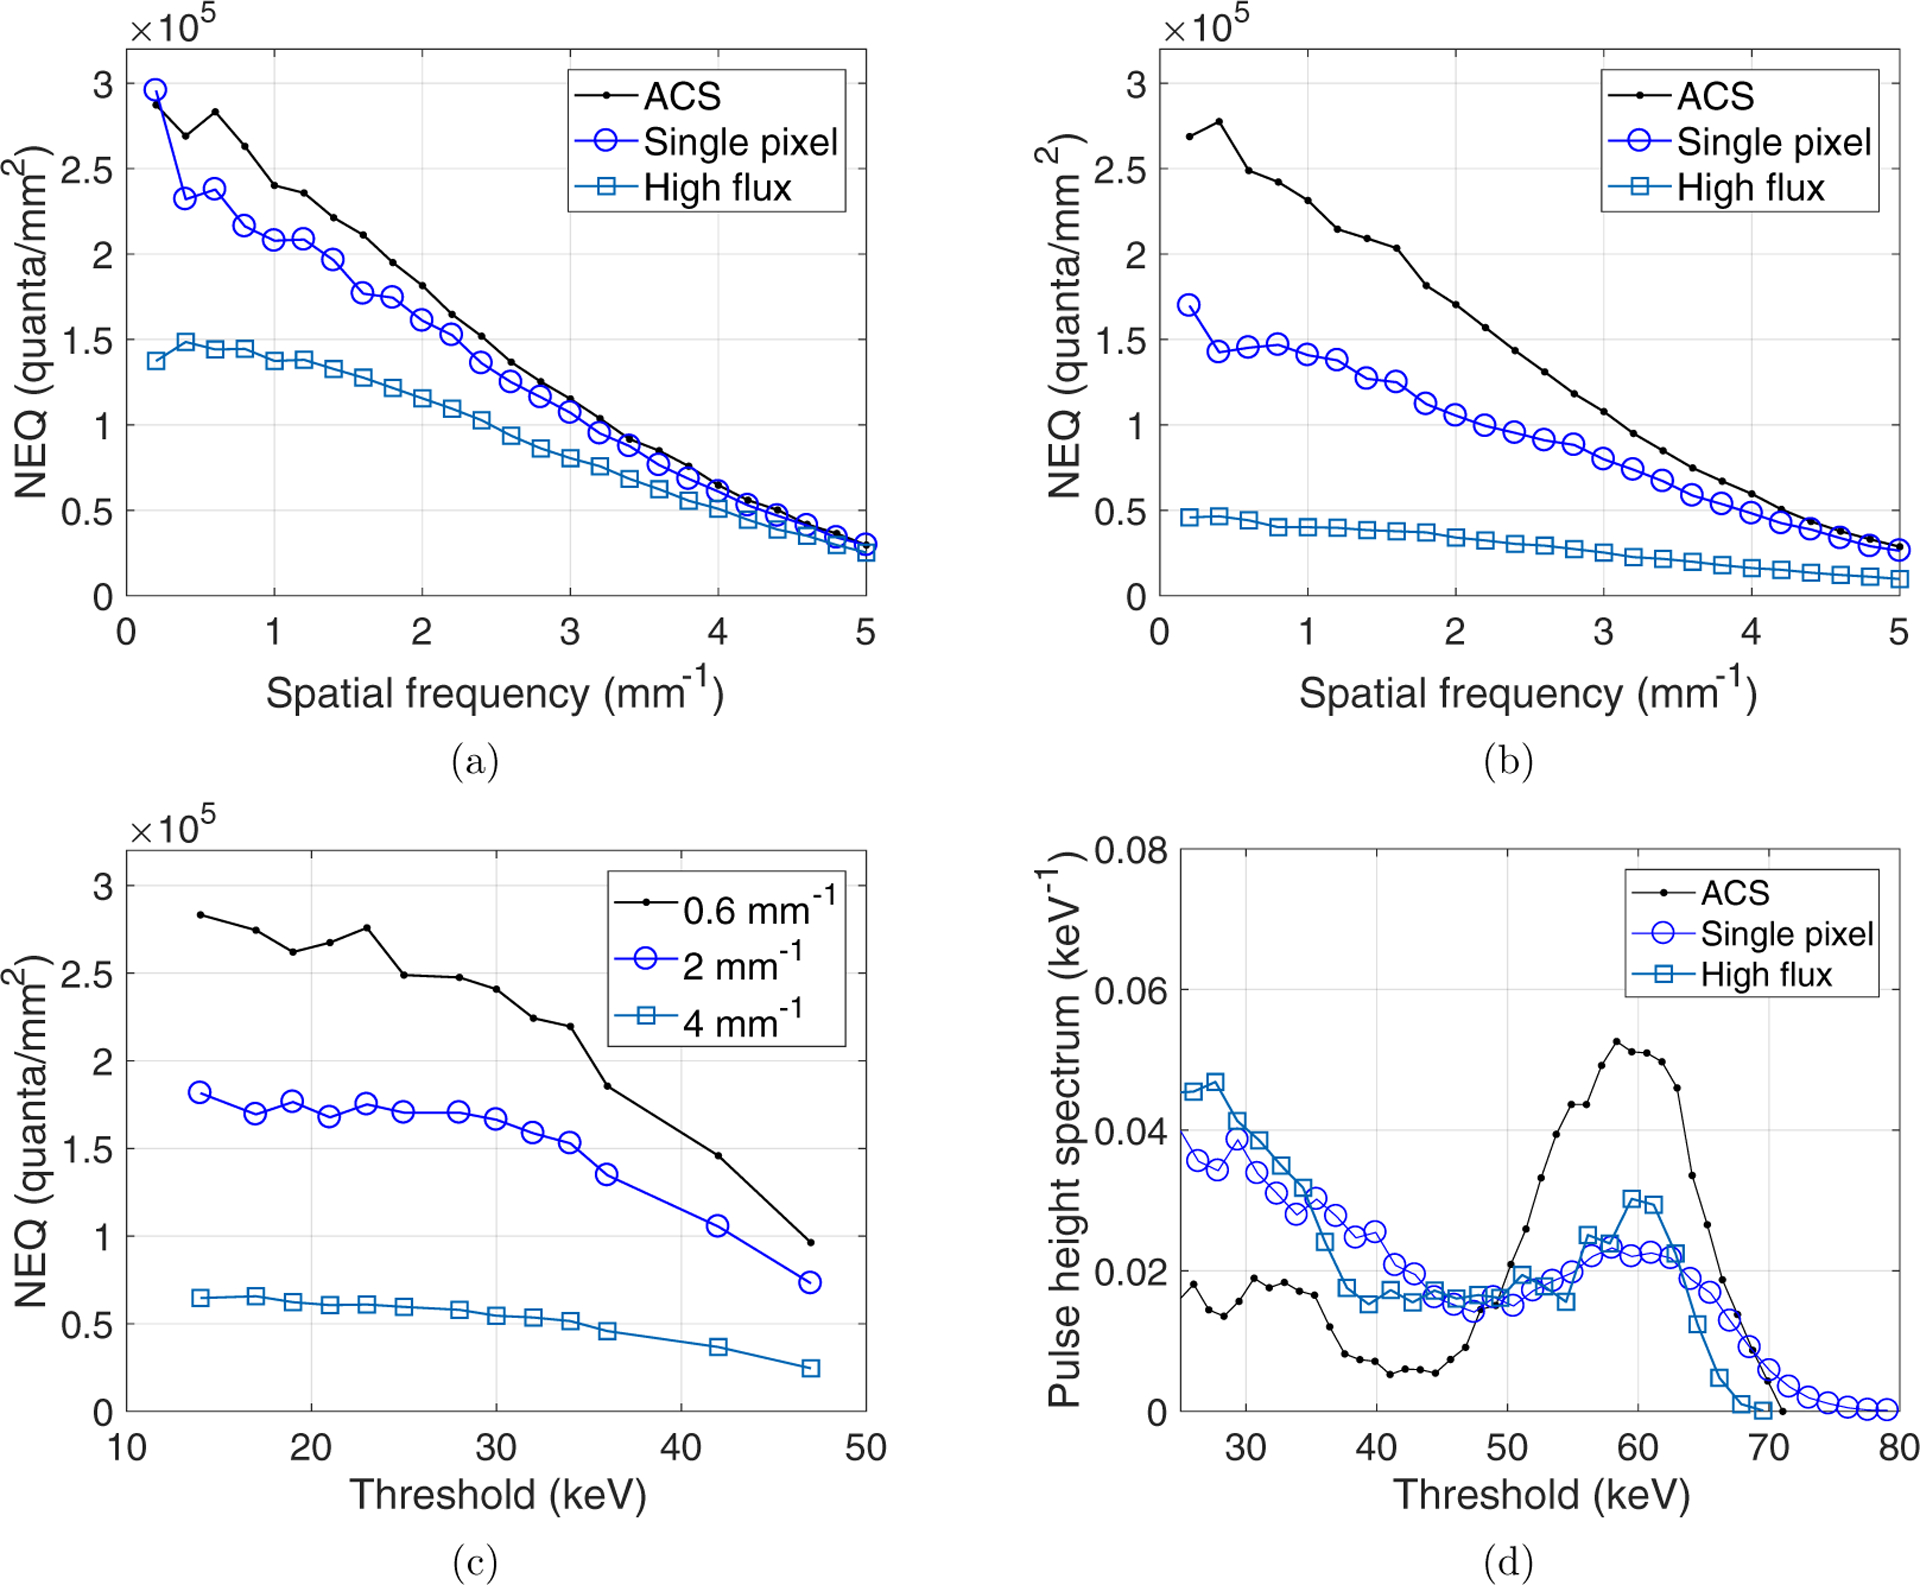
(a) Comparison of NEQ(k) curves of the PCD system measured at three detection modes and the lowest energy threshold level (15 keV). (b) NEQ(k) curves of the three detection modes measured at a higher energy threshold level (25 keV). (c) Dependence of NEQ(k) of the ACS mode on the energy threshold levels. (d) Pulse height spectra of the three PCD detection modes measured using an americium-241 source.
For a given detection mode, it was found that the lowest energy threshold always led to the highest NEQ (k) at all spatial frequencies evaluated. Taking the ACS mode as an example, figure 4(c) shows that at each of the three representative frequency levels (k = 0.6, 2, or 4 lp mm−1), the values of the NEQ generally increased with a lower energy threshold level.
The measured PCD dead times (τ) for the three detection modes are 0.063 μs (high flux mode), 0.19 μs (single pixel mode), and 1.4 μs (ACS mode) at the flux level indicated in equation (14). The corresponding count loss fractions (ε) are 0.4% (high flux mode), 1.3% (single pixel mode), and 9.3% (ACS mode). Therefore, count loss evaluated at the fluence rate of clinical head CT exam was acceptable for all three modes.
To confirm the impact of count loss to the non-spectral PCCT image quality is indeed negligible, figure 5 shows PCCT images acquired using the three detection modes. Even with a higher count loss fraction, the ACS mode still generated images with slightly lower noise because of its higher NEQ: the measured noise standard deviations of the ACS, single pixel, and high flux modes are 21.0, 24.7, and 26.3 HU, respectively. Further, the ACS mode has an additional advantage of much better energy resolution (figure 4(d)), which can potentially benefit the spectral data acquired simultaneously with the non-spectral data. Therefore, the ACS mode was chosen as the most favorable detector mode.
Figure 5.
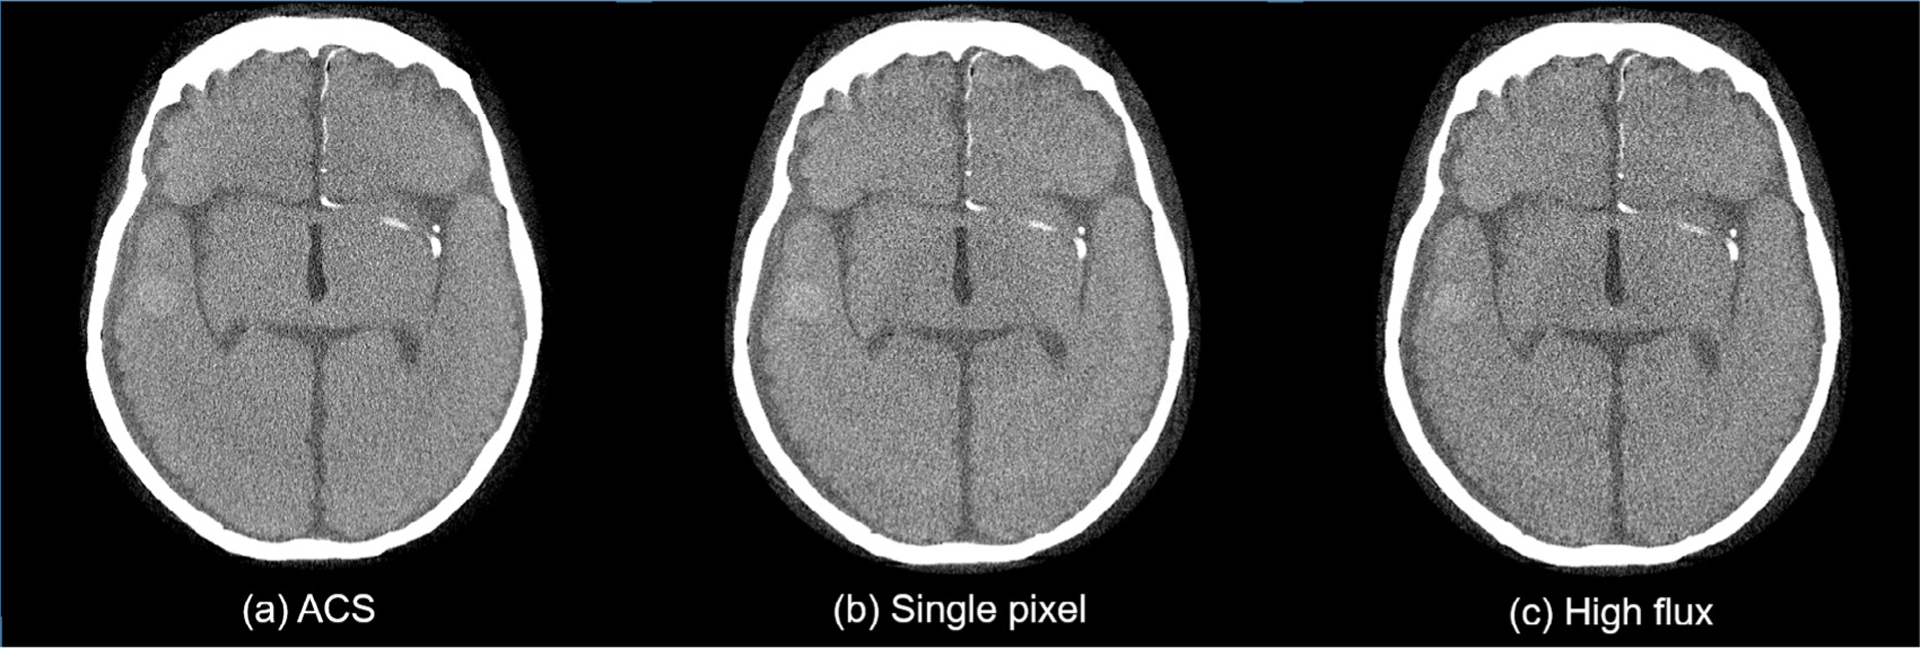
Comparison of PCCT images acquired using three different PCD detection modes. For all three images, display W/L =30/200 HU, reconstruction kernel = ramp, slice thickness =3 mm, energy threshold = 15 keV.
In summary of the above experimental results, the combination of the ACS detection mode and the 15 keV energy threshold meets the condition in equation (11). Therefore, the optimality of this parameter combination is generic for non-spectral ICH imaging tasks, and thus all subsequent PCCT acquisitions were performed using this PCD setup.
3.2. Optimal reconstruction kernel
For each of the three ICH imaging tasks, figure 6 plots the measured d′ values as a function of parameter a in equation (1). For the 4 mm/10 HU intraparenchymal hemorrhage detection task and the sulcus discrimination task, the d′ peaked at a = 0.23 mm. For the 1.5 mm/50 HU subarachnoid hemorrhage detection task, within the range of a ∈ [0, 0.23]mm, d′ stayed very close to the maximum value. Therefore, the optimal value for parameter a in equation (1) was chosen to be 0.23 mm.
Figure 6.
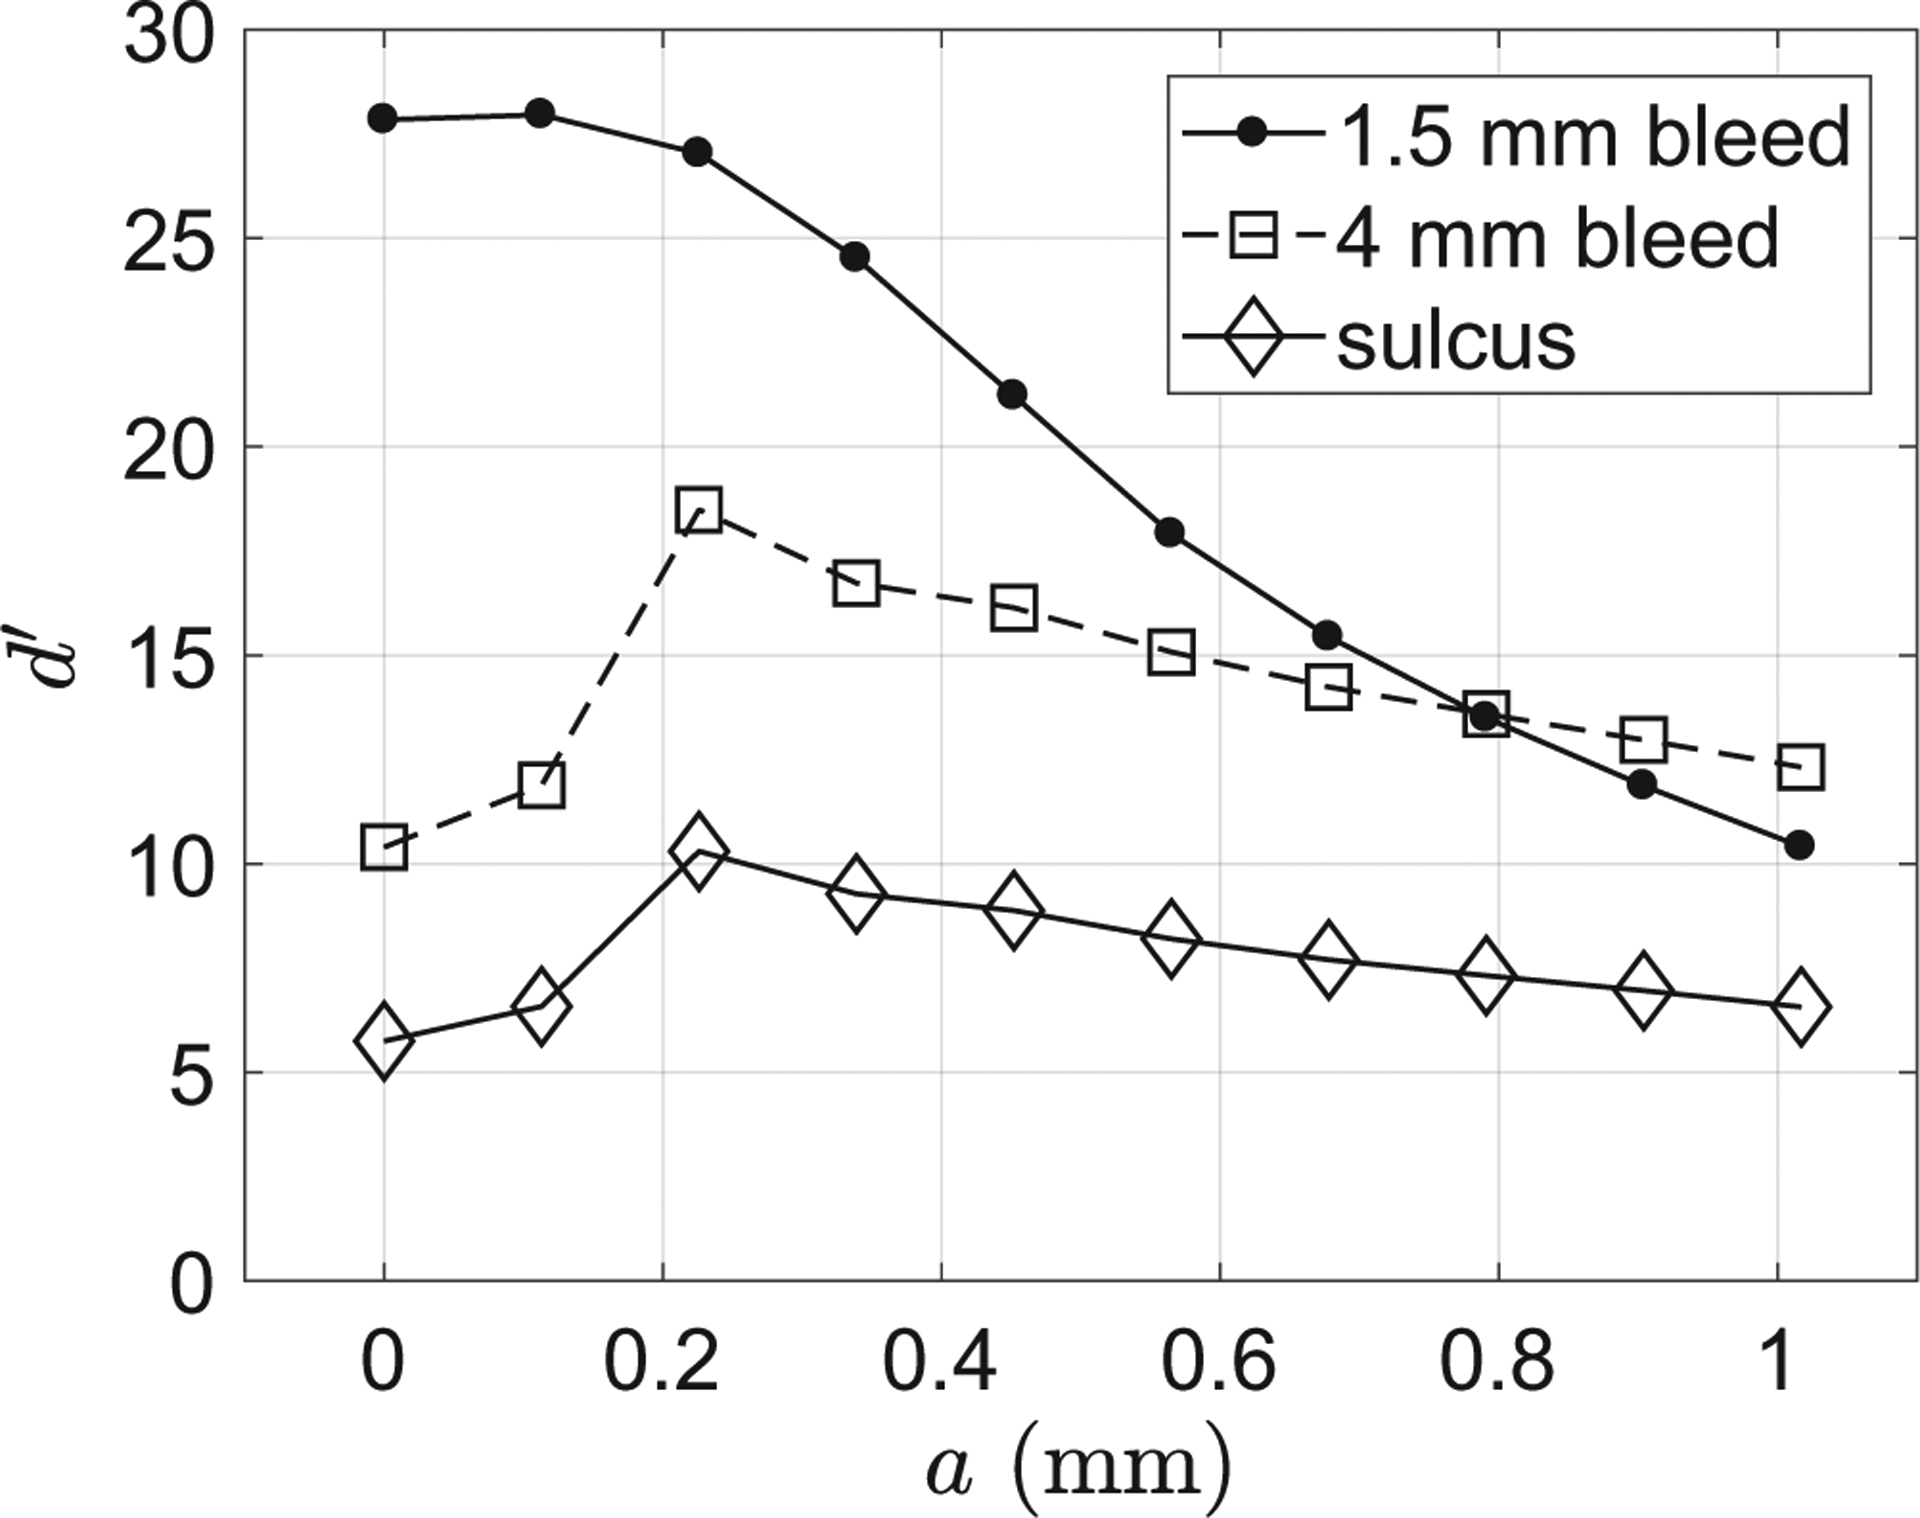
Dependence of the ideal observer detectability index (d′) on the reconstruction kernel parameter (a) for the three ICH imaging tasks.
These d′ results echo with the corresponding CT images shown in figure 7: the visibility of the 4 mm bleed and the sulcus was significantly compromised when no apodization was applied (i.e. a = 0). On the other hand, the edge definition of this bleed was impaired when the apodization strength was too strong (a = 1.0 mm). Similarly, figure 8 shows that the detection of the smaller (1.5 mm) bleed directly benefited from the optimized reconstruction kernel.
Figure 7.
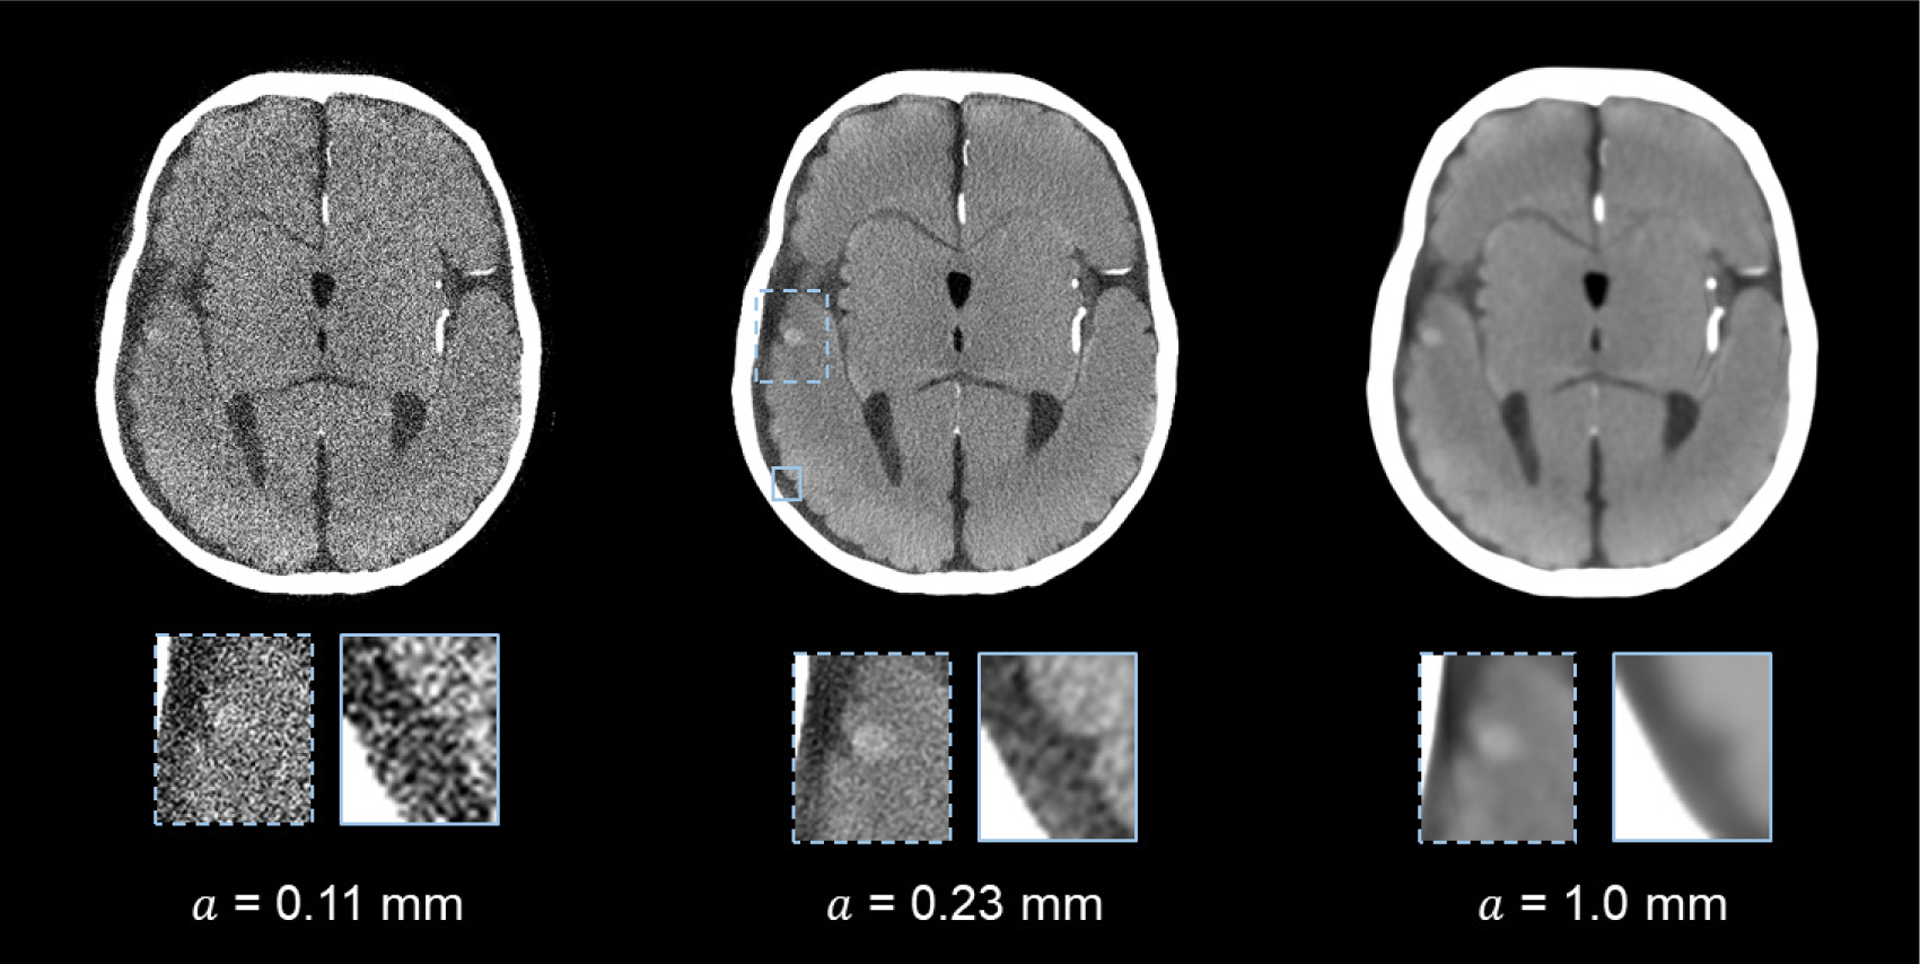
PCCT images of the 4.0 mm intraparenchymal hemorrhage model and the sulcus. The images were reconstructed using different a (apodization window width) values. Display W/L: 100/30 HU.
Figure 8.
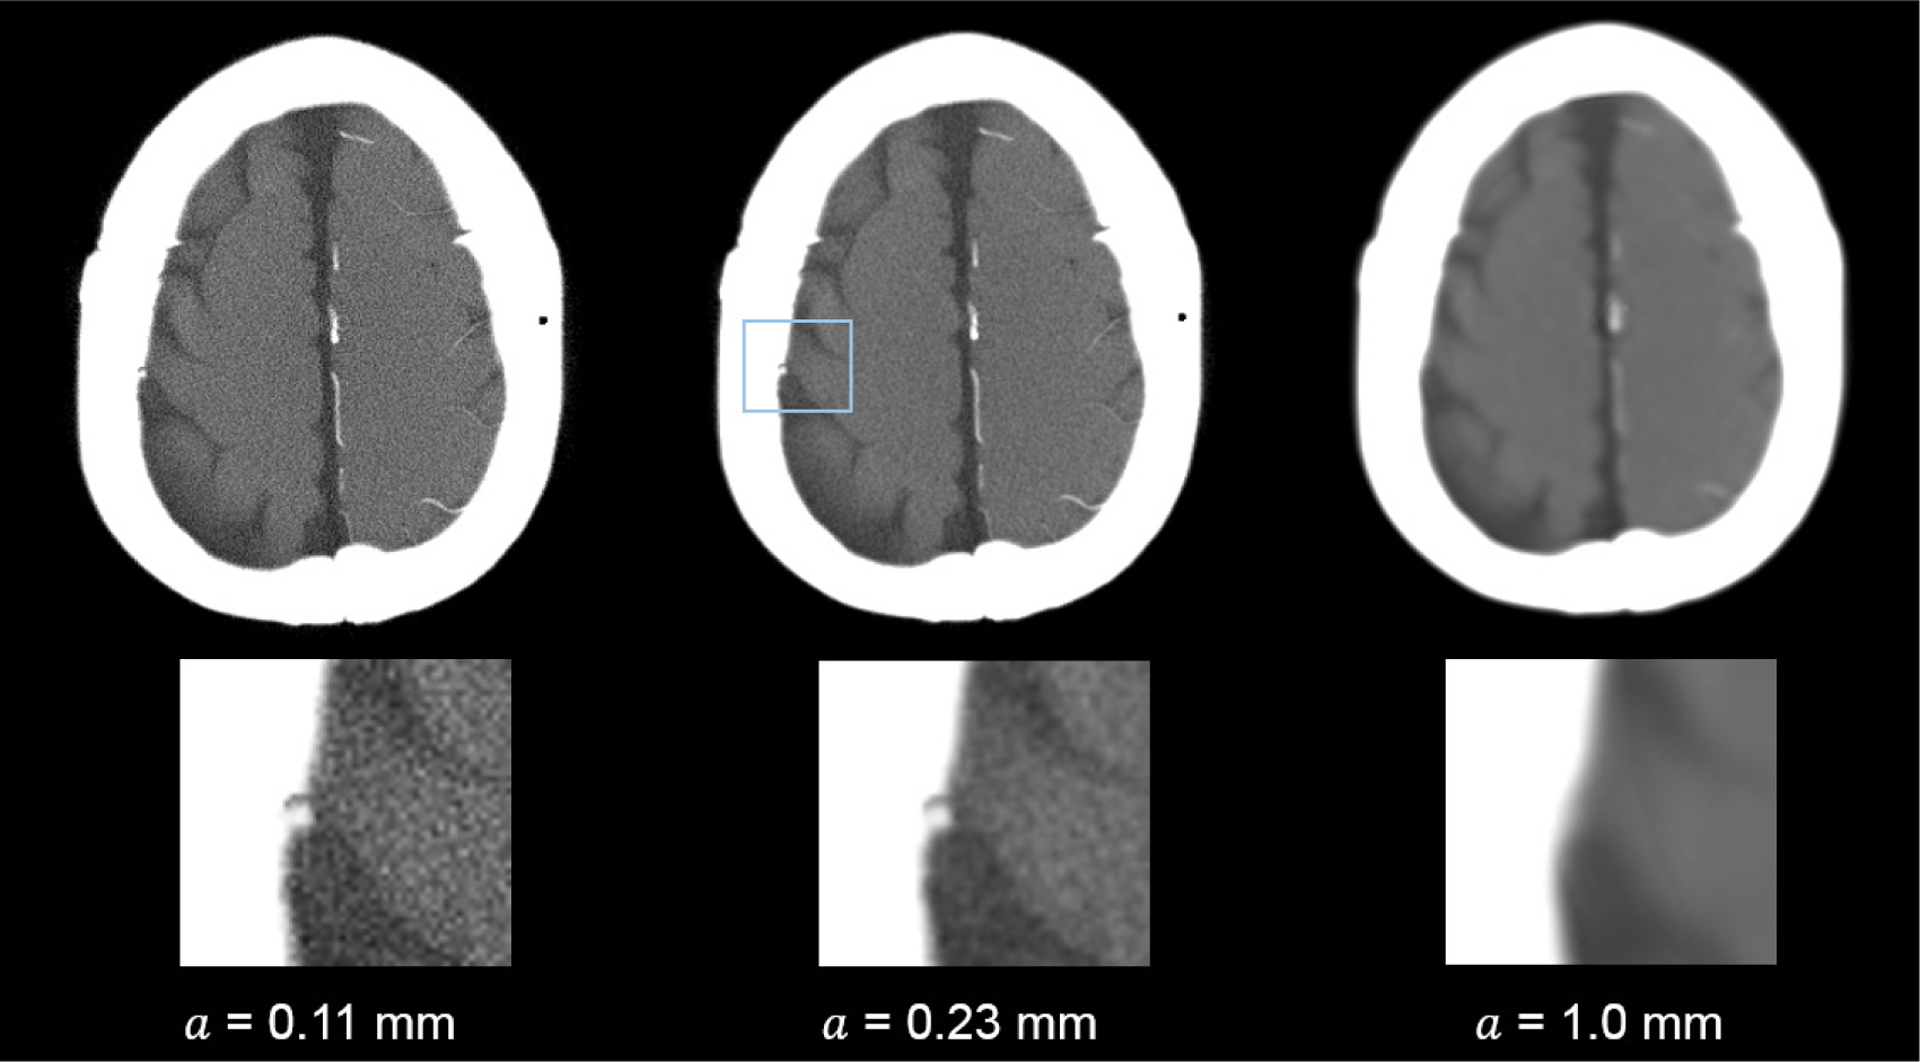
PCCT images of the 1.5 mm subarachnoid hemorrhage model. The images were reconstructed using different a (apodization window width) values. Display W/L: 260/50 HU.
3.3. Comparison with MDCT
The MTF and NPS of PCCT images obtained with the optimal kernel are shown in figure 9. The same figure also includes the MTF and NPS of MDCT. To facilitate the comparison between PCCT and MDCT at a matched spatial resolution, an additional reconstruction kernel for PCCT, referred to as ‘PCCT Soft kernel’, was designed by setting a = 0.45 mm. This kernel provides PCCT with an MTF similar to that of the MDCT Soft kernel. The NPS and MTF of the ‘PCCT Soft kernel’ are shown in figure 9. Although the Bone Plus kernel used in MDCT generated a superior spatial resolution, it significantly amplified image noise, evidenced by its much higher NPS amplitude. When the spatial resolution of the MDCT and PCCT was matched, PCCT offers lower image noise, as indicated by the NPS results in figure 9(b).
Figure 9.
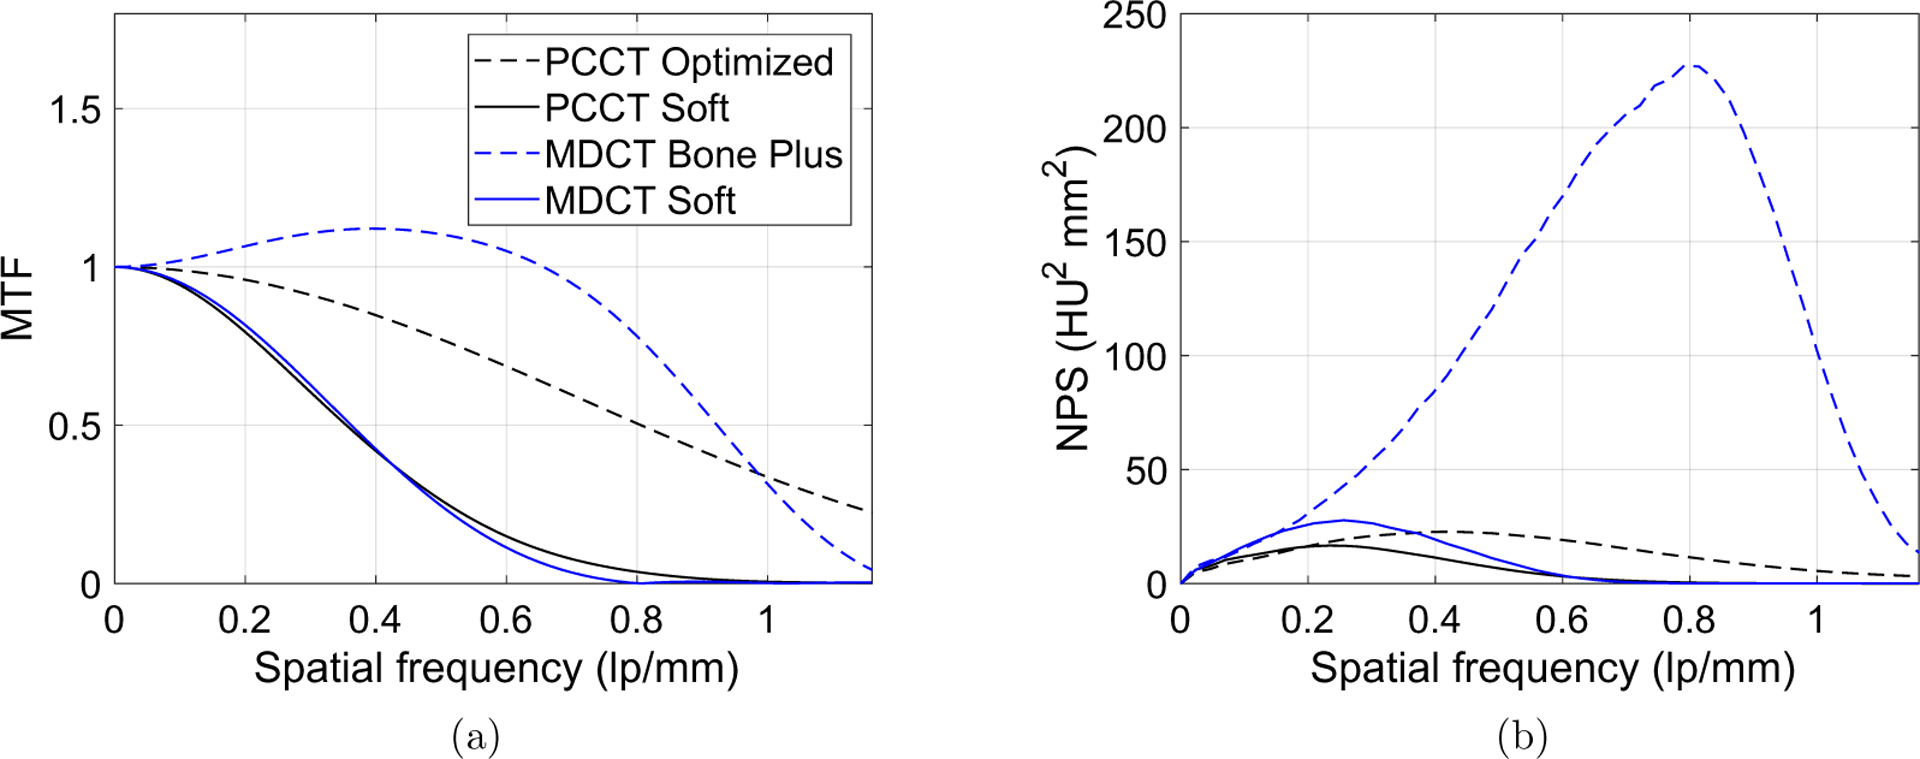
Comparison of MTF(a) and NPS(b) between PCCT and MDCT. (a) and (b) share the same legend.
Values of d′ of MDCT and PCCT are compared in figure 10. The optimized PCCT provided at least 20% improvement in d′ for all three image tasks. The d′ results were consistent with the reconstructed images in figures 11 and 12. When the spatial resolution was matched, PCCT produced less image noise and better visualization of the imaging tasks. The benefits of PCCT became even more pronounced with the use of the optimal reconstruction kernel. For the 4.0 mm bleed, PCCT offered better boundary delineation compared with the MDCT soft image, and it offered much lower noise compared with the MDCT Bone plus kernel. The sulcus can be clearly differentiated using the PCCT but was barely visible using MDCT, no matter whether the Soft kernel or the Bone plus kernel is applied. For the 1.5 mm small bleed, the optimized PCCT images reduced the pixel blooming artifacts so that the bleed can be clearly separated from the nearby bone structures. Finally, the performance of the PCCT system for imaging a large (19 mm) intraparenchymal bleed was evaluated. As shown in figure 13, PCCT and MDCT have comparable performance for this less challenging task.
Figure 10.

Comparison of d′ between PCCT and MDCT for the three ICH imaging tasks: (a) 1.5 mm bleed model; (b) 4 mm bleed model; (c) sulcus discrimination task. The legend in (a) also applies to (b) and (c).
Figure 11.
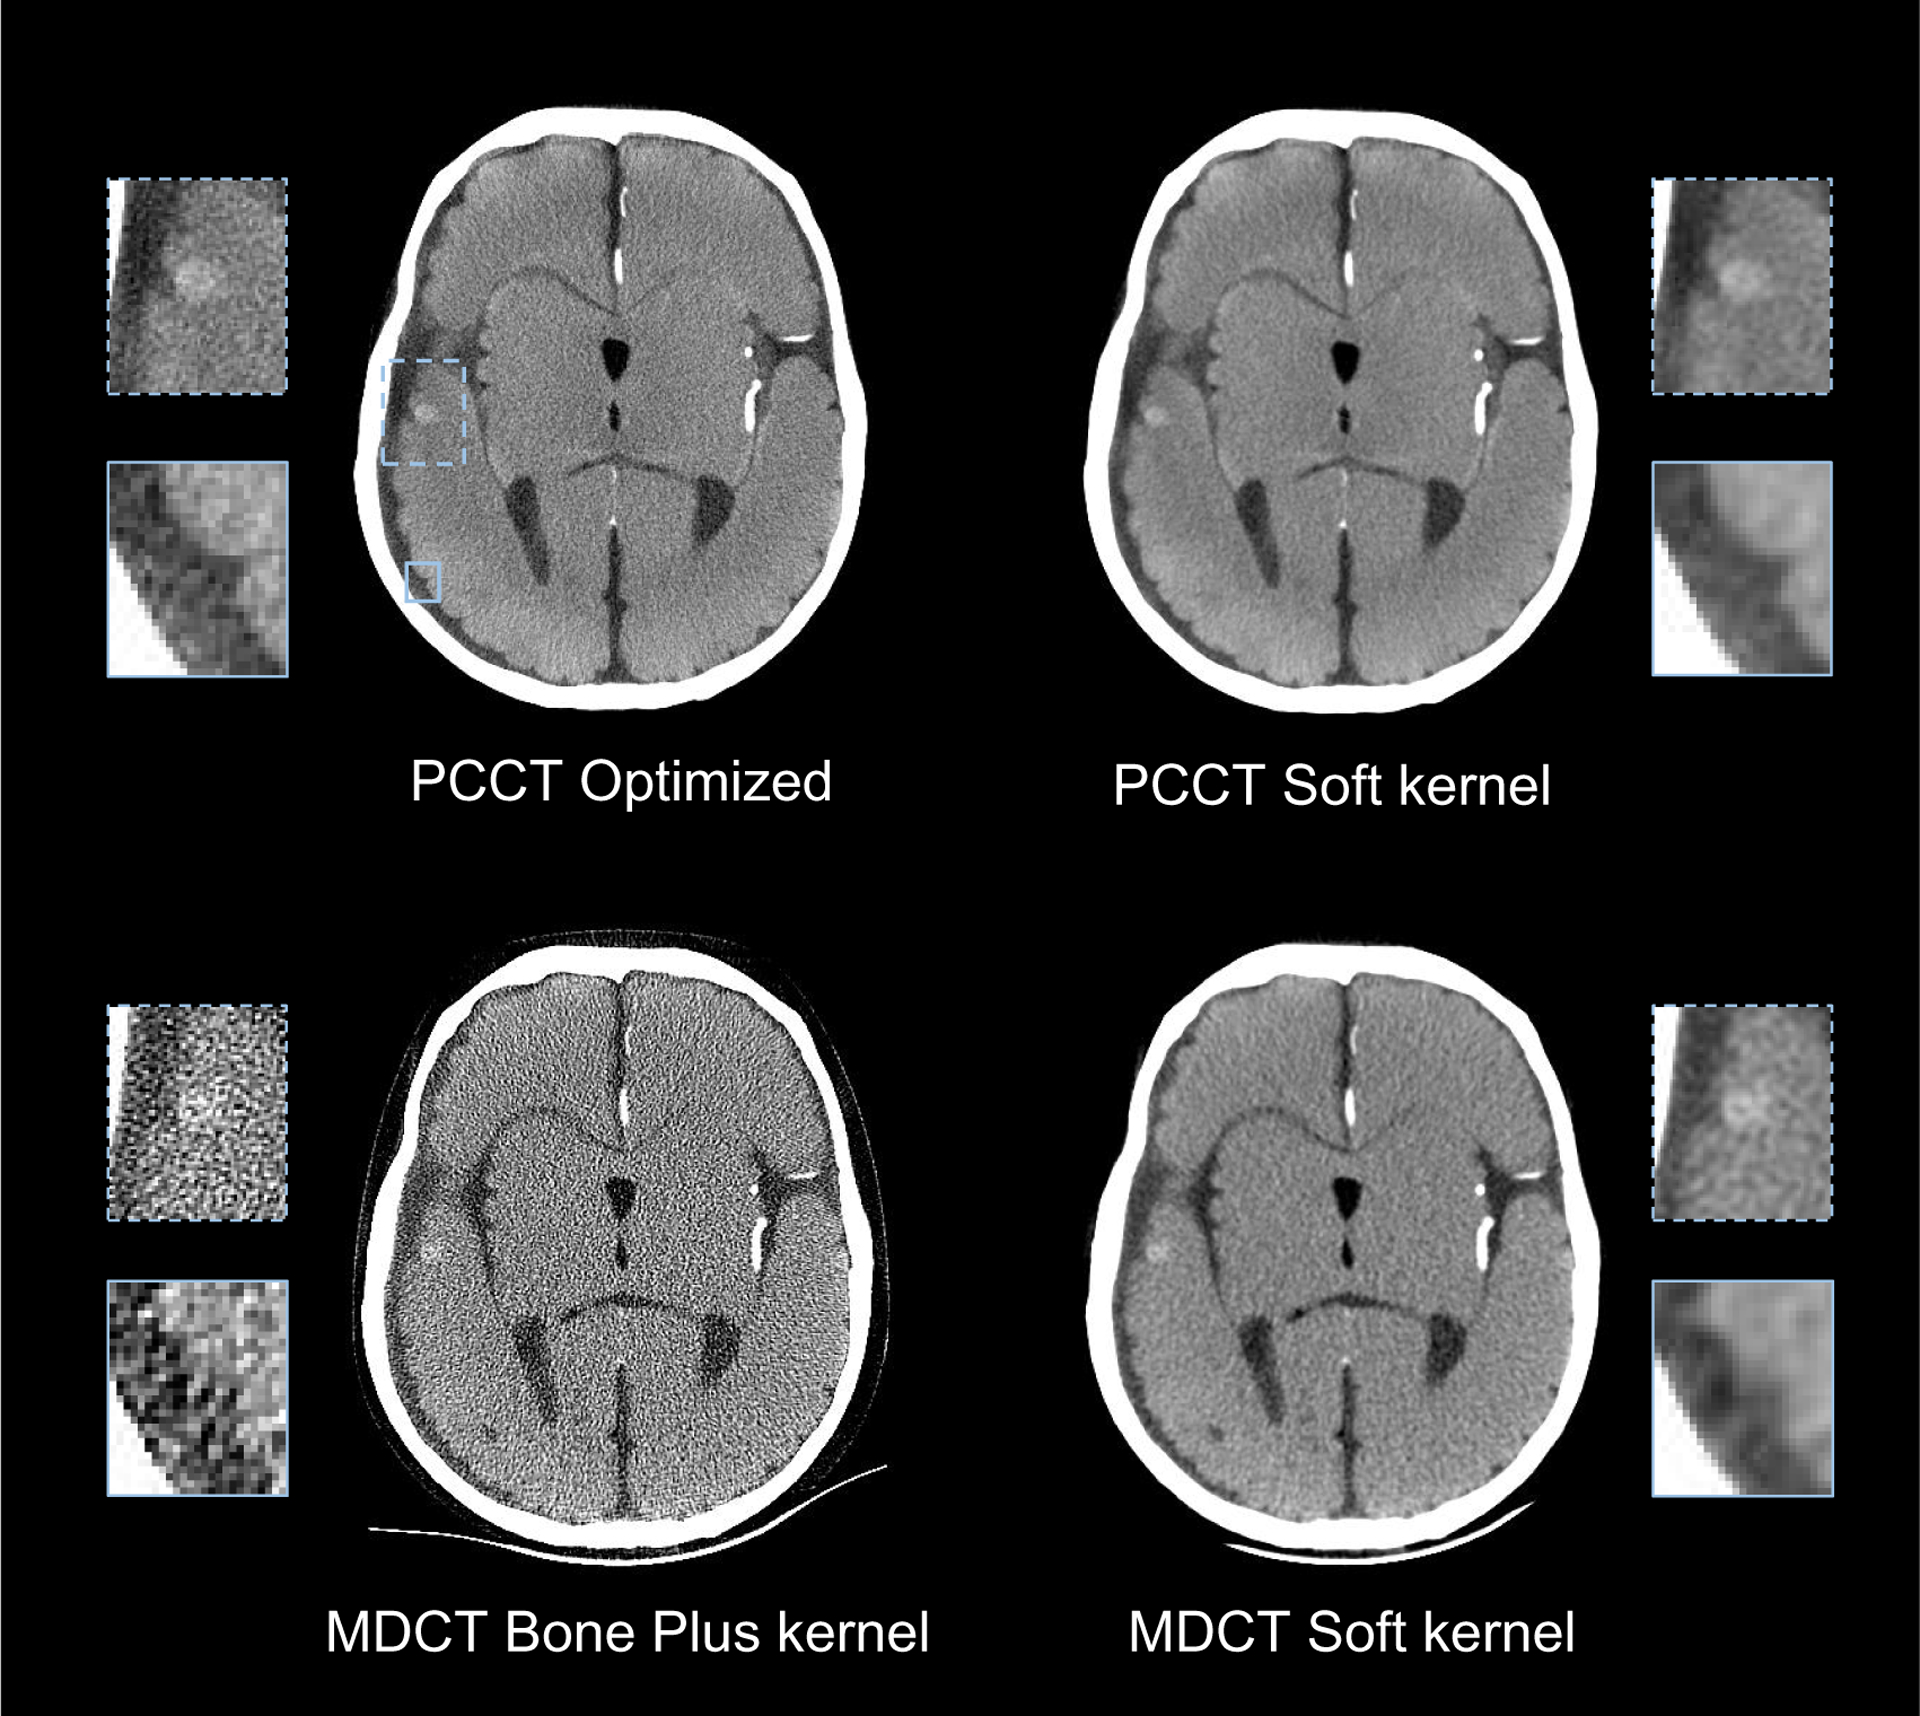
Comparison of PCCT and MDCT images for the 4 mm bleed detection task and the sulcus discrimination task.
Figure 12.
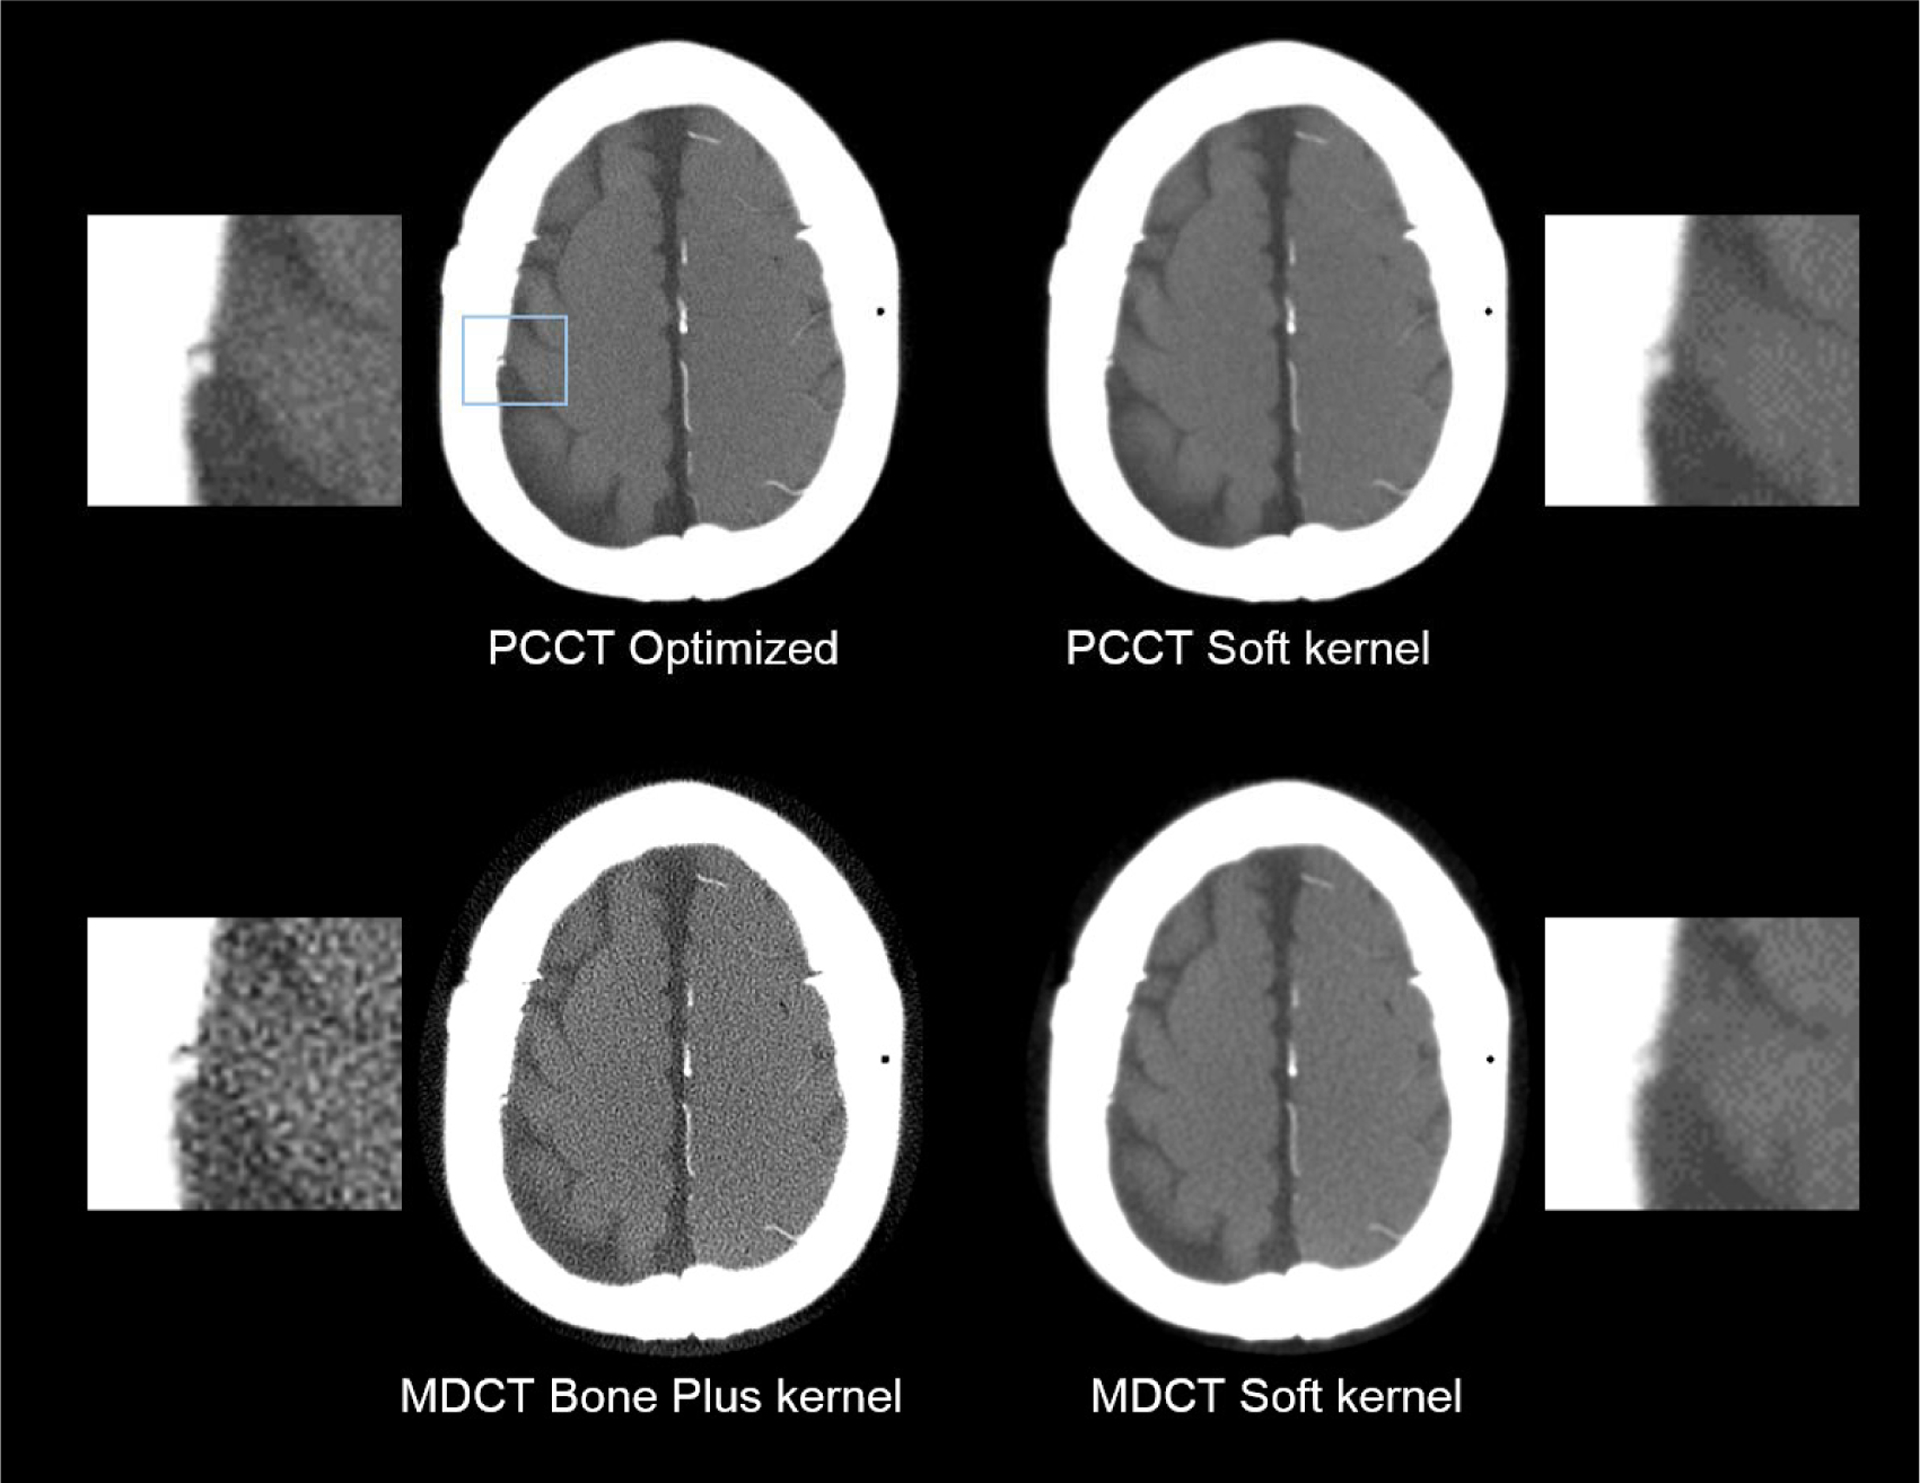
Comparison of PCCT and MDCT images for the 1.5 mm bleed detection task.
Figure 13.
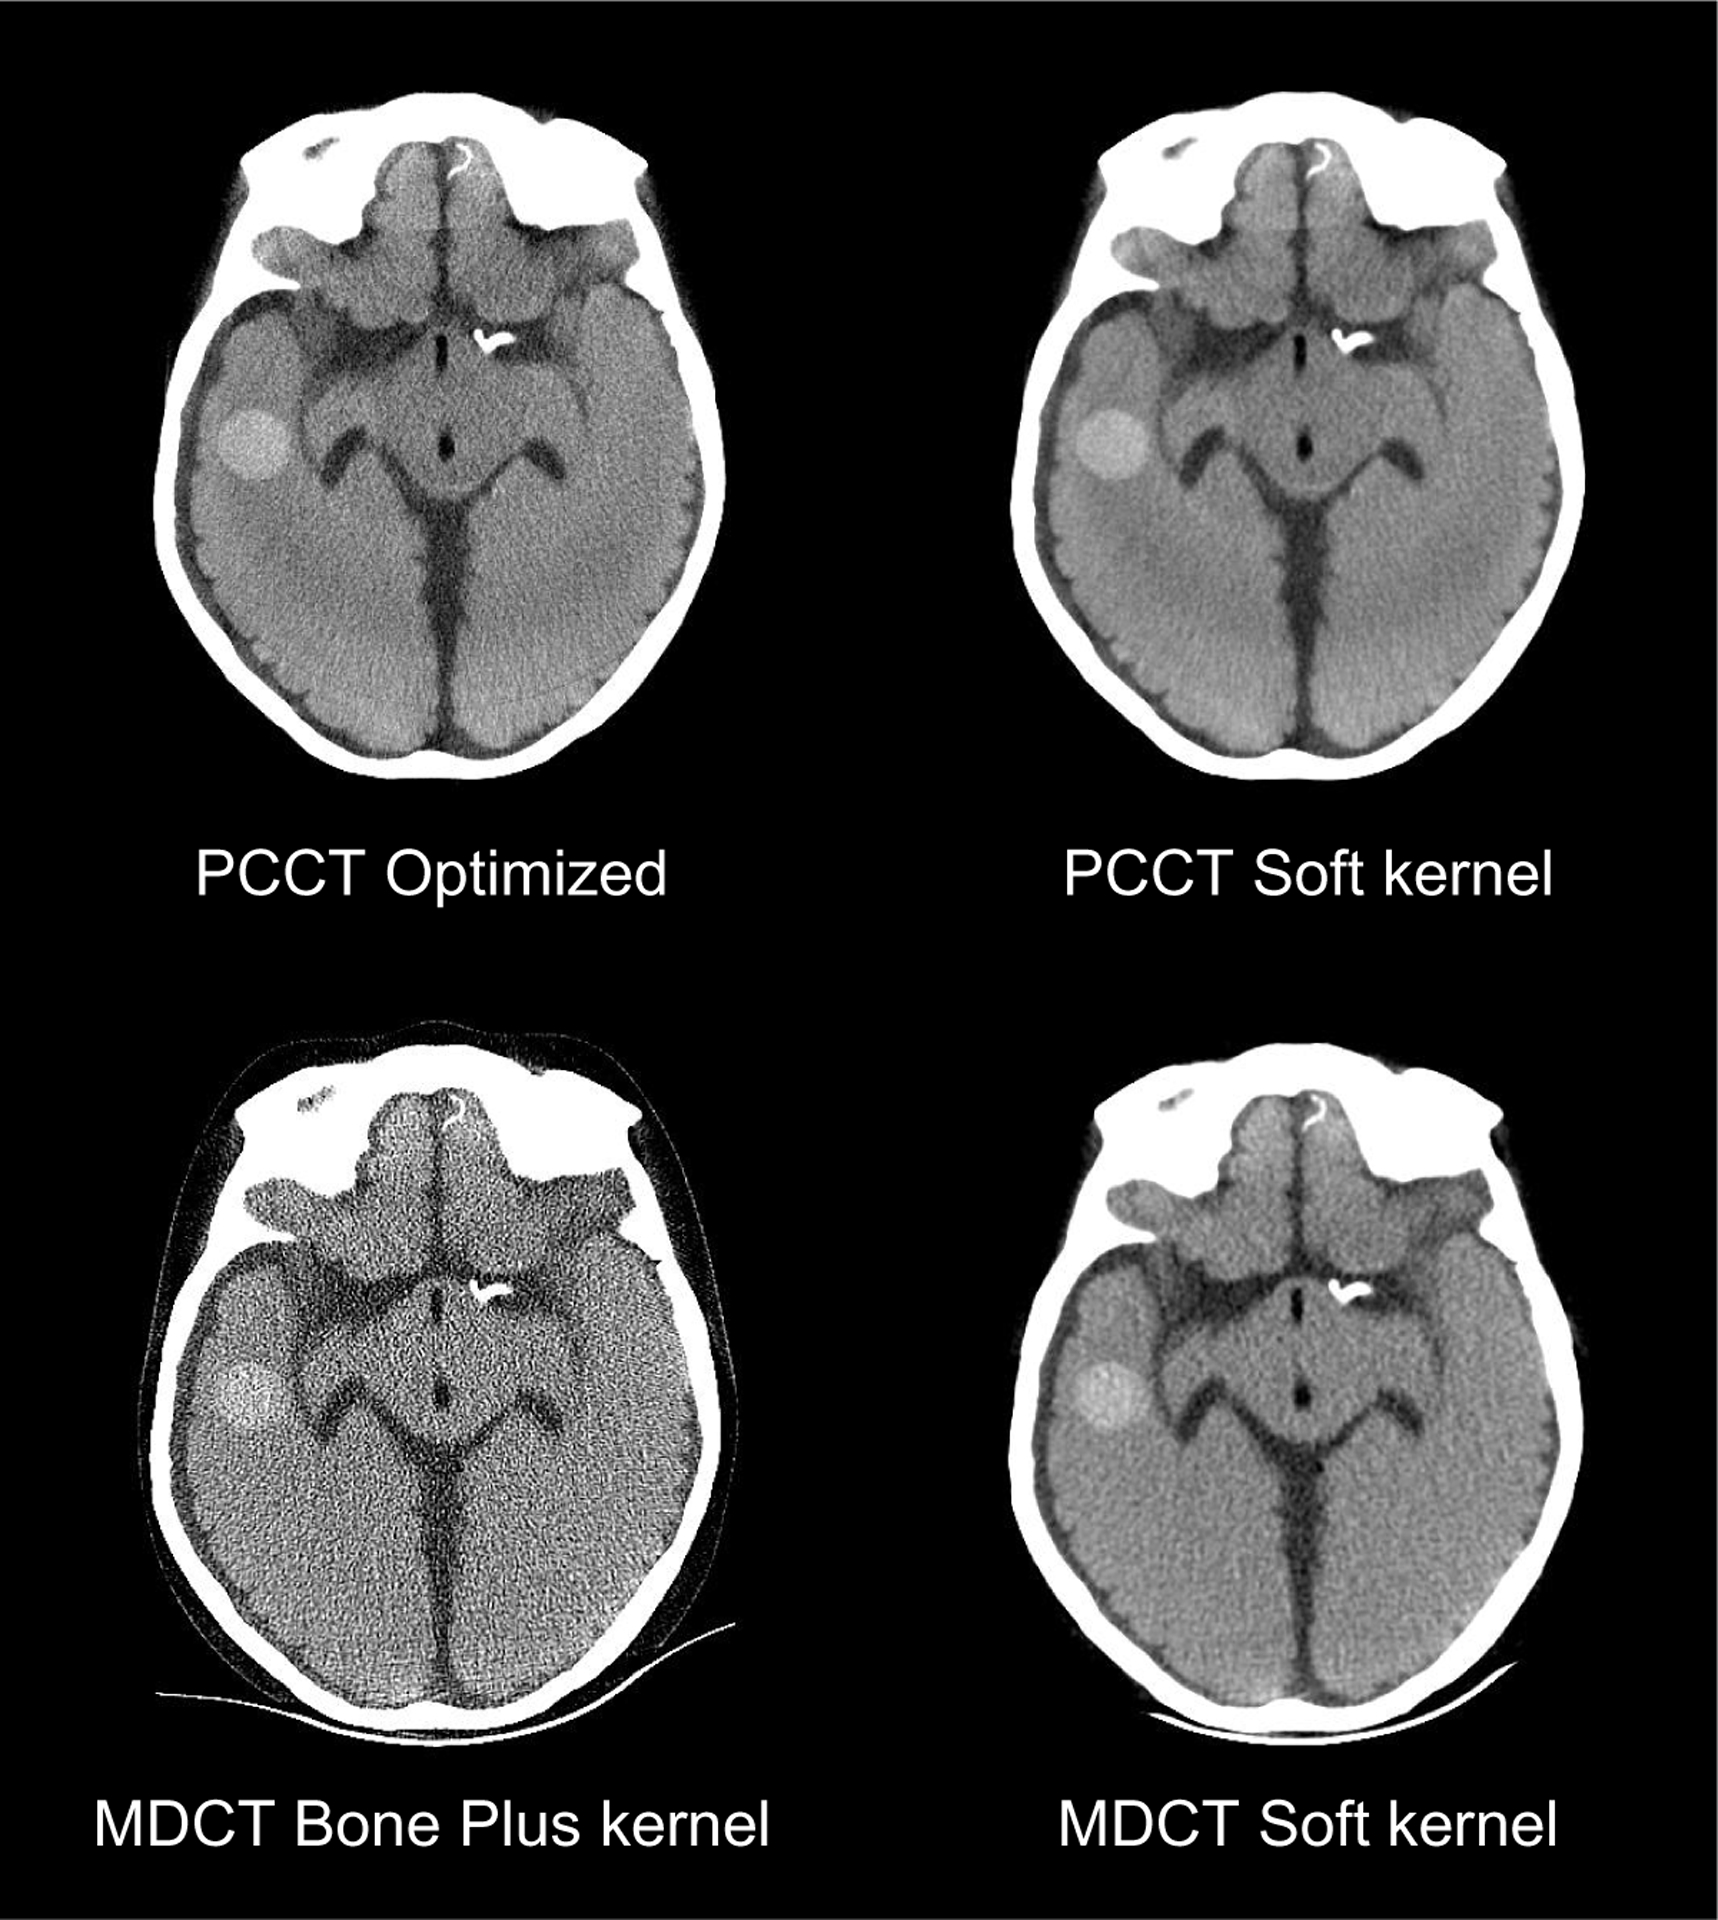
Comparison of PCCT and MDCT images for the detection of a large (19 mm) intraparechymal bleed.
4. Discussion
Towards addressing the technical challenges of MDCT in imaging ICH (detections of chronic bleeds and microbleeds, predicting of hemorrhagic transformation, etc), the non-spectral NCCT scan mode of an experimental PCCT system that simulates the geometry of a general purpose MDCT was optimized. Under the guidance of the task-based observer model framework, the detection mode, energy threshold, and reconstruction kernel were optimized for three representative ICH imaging tasks. It was found that the ACS detection mode provides the highest system NEQ and d′ for a given radiation dose budget, and there was no significant impact of pulse pileup at a clinically relevant x-ray fluence rate. Based on these experimental observations, the ACS mode was considered optimal for the ICH imaging tasks. The optimal energy threshold of the PCD was found to be 15 keV, and the optimal reconstruction apodization strength (a) was found to be 0.23 mm.
Compared with conventional MDCT systems, the optimized PCCT system offered higher d′ for all three ICH tasks. The superior high-frequency performance of PCCT also effectively reduced pixel blooming, which could benefit the visualization of fissures, sulcus, ventricles, and midlines directly relevant for the assessment of hemorrhagic transformation risk. To facilitate a straightforward comparison, an additional reconstruction kernel was applied to PCCT, so that the spatial resolutions of PCCT and MDCT were matched. Under this condition, it was found that PCCT generated lower image noise due to its higher system efficiency.
In addition to ICH imaging, the method presented in this work can be potentially extended to the optimization of non-spectral PCCT for other clinical applications. Compared with conventional CT detectors, PCD introduces additional system parameters that can complicate the clinical operation of PCCT. This work specifies the conditions under which the optimization of detector parameters can be decoupled from the clinical task and simplified. When these conditions are not met, a pool of task models relevant to the clinical application can be pre-defined, and the ideal observer performance of these tasks can guide the selection of PCCT parameters.
This work contains the following limitations: first, although the experiments were designed towards providing a fair comparison between PCCT and MDCT, several physical factors were not matched between the two CT systems due to various hardware constraints. For example, the PCCT system does not employ an anti-scatter grid or other scatter correction methods as in MDCT. This condition may or may not favor one system over the other depending on the scatter condition and grid design. As another example, the beam spectra of the two systems might not be perfectly matched, despite the fact that both were operated at the same kV. In addition, the number of view angles in PCCT (1500) was larger than that of MDCT (984). Currently, the minimal number of views in PCCT is limited by the small bit depth (12 bit) of our PCD system: in order to deliver the prescribed radiation dose (48 mGy) without saturating the narrow dynamic range (0–4095 counts per pixels) of the detector, photons have to be distributed to no less than 1500 projections. With further upgrades of the PCD hardware, we look forward to matching the total view numbers of the two systems in our future work, so that it will no longer be a confounding factor in system comparison. Next, an important parameter that was not matched between the two systems was the rotation time. For the PCCT system used in this work, the scan speed (50 s) was limited by two hardware constraints: (1) the much lower power rating (1 MHU) of its tube-generator assembly (compared with 7 MHU in MDCT), and (2) the much lower frame rate of the PCD system (150 Hz maximal, compared with 7134 Hz for the MDCT detector system). Prior works from another group have demonstrated the capability of the latest PCD technology to work at typical rotation speed, frame rate, and mA levels as in clinical head CT without significant pulse pileup (Yu et al 2016). Therefore, it is reasonable to assume the scan time overhead in our PCCT is not fundamentally limited by the PCD technology itself. However, this assumption needs to be further validated upon the upgrade of our system hardware. Second, some PCCT images such as those shown in figure 13 contain certain band-shaped shading artifacts that were caused by the variation of the detector response curve across different PCD panels. The conventional flood field correction method employed in this work did not completely eliminate the nonuniformity across the panels, because (i) the mean energy of the x-ray photons recorded in the air-scan is significant lower than that of the phantom scan and (ii) the dependence of the response curve on x-ray energy is nonlinear and varies across PCD panels. Third, the PCCT system presented in this work only used FBP reconstruction and has not employed other advanced CT reconstruction methods. Recently, model-based iterative reconstruction (MBIR) has been applied to dedicated cone-beam head CT systems and demonstrated potential in improving ICH imaging performance (Dang et al 2016, 2017, Xu et al 2016, Sisniega et al 2017). Built upon the presented FBP-based results, our future work will investigate how to incorporate the physical model of PCD into the MBIR framework to benefit ICH imaging. Lastly, this work strictly focused on the non-spectral mode of PCCT. How to optimally utilize the spectral PCCT images simultaneously acquired from the same scan is another topic of our future work.
5. Conclusions
For non-contrast and non-spectral ICH imaging, the ACS detection mode, 15 keV threshold, and an apodized ramp kernel generates the optimal performance of a PCCT system. Compared with MDCT, PCCT provides higher detectability for low contrast bleeds, microbleeds, and sulcus, which indicated the potential benefits of PCCT in diagnosing existing hemorrhages and predicting hemorrhagic transformation risks.
Acknowledgments
This work was partially supported by the National Institute of Biomedical Imaging and Bioengineering of the National Institutes of Health under Award Number U01EB021183. Opinions, interpretations, conclusions and recommendations are those of the authors; they do not necessarily represent the official views of the National Institutes of Health. The authors would like to thank Kevin Treb for his editorial assistance.
References
- AAPM Task Group 23 2008. AAPM Report No. 96: The Measurement, Reporting, and Management of Radiation Dose in CT (AAPM) ACR 2016 Appropriateness Criteria–Cerebrovascular Disease (Reston, VA, USA: American College of Radiology; ) (https://acsearch.acr.org/docs/69478/Narrative/) [Google Scholar]
- Ballabriga R, Campbell M, Heijne EHM, Llopart X and Tlustos L 2007. The Medipix3 prototype, a pixel readout chip working in single photon counting mode with improved spectrometric performance IEEE Trans. Nucl. Sci 54 1824–9 [Google Scholar]
- Barrett HH, Yao J, Rolland JP and Myers KJ 1993. Model observers for assessment of image quality Proc. Natl. Acad. Sci 90 9758–65 [DOI] [PMC free article] [PubMed] [Google Scholar]
- Barrett JF and Keat N 2004. Artifacts in CT: recognition and avoidance RadioGraphics 24 1679–91 [DOI] [PubMed] [Google Scholar]
- Bisogni MG. et al. Performance of a 4096 pixel photon counting chip. Proc. SPIE. 1998;3445:34457. [Google Scholar]
- Boccardi E, Cenzato M, Curto F, Longoni M, Motto C, Oppo V, Perini V and Vidale S 2017. Hemorrhagic Stroke (Emergency Management in Neurology) 1st edn (Berlin: Springer; ) [Google Scholar]
- Brandt L, Sonesson B, Ljunggren B and Saveland H 1987. Ruptured middle cerebral artery aneurysm with intracerebral hemorrhage in younger patients appearing moribund: emergency operation? Neurosurgery 20 925–9 [DOI] [PubMed] [Google Scholar]
- Burgess A 1999. The Rose model, revisited J. Opt. Soc. Am. A 16 633–46 [DOI] [PubMed] [Google Scholar]
- Cahn RN, Cederstrom B, Danielsson M, Hall A, Lundqvist M and Nygren D 1999. Detective quantum efficiency dependence on x-ray energy weighting in mammography Med. Phys 26 2680–3 [DOI] [PubMed] [Google Scholar]
- Campbell M, Heijne EHM, Meddeler G, Pernigotti E and Snoeys W 1998. A readout chip for a 64 × 64 px matrix with 15-bit single photon counting IEEE Trans. Nucl. Sci 45 751–3 [Google Scholar]
- Chen W, Zhu W, Kovanlikaya I, Kovanlikaya A, Liu T, Wang S, Salustri C and Wang Y 2014. Intracranial calcifications and hemorrhages: characterization with quantitative susceptibility mapping Radiology 270 496–505 [DOI] [PMC free article] [PubMed] [Google Scholar]
- Dang H, Stayman JW, Sisniega A, Zbijewski W, Xu J, Wang X, Foos DH, Aygun N, Koliatsos VE and Siewerdsen JH 2016. Multi-resolution statistical image reconstruction for mitigation of truncation effects: application to cone-beam CT of the head Phys. Med. Biol 62 539. [DOI] [PMC free article] [PubMed] [Google Scholar]
- Dang H et al. 2017. Task-based statistical image reconstruction for high-quality cone-beam CT Phys. Med. Biol 62 8693. [DOI] [PubMed] [Google Scholar]
- FDA. FDA drug safety communication: Safety review of post-market reports of serious bleeding events with the anticoagulant Pradaxa (dabigatran etexilate mesylate) U.S. Food and Drug Administration; 2012. [Google Scholar]
- Ferreira da Silva I R and Provencio JJ 2015. Intracerebral hemorrhage in patients receiving oral anticoagulation therapy J. Intensive Care Med 30 63–78 [DOI] [PubMed] [Google Scholar]
- Ferrero A, Gutjahr R, Halaweish AF, Leng S and McCollough CH 2018. Characterization of urinary stone composition by use of whole-body, photon-counting detector CT Acad. Radiol 25 1270. [DOI] [PMC free article] [PubMed] [Google Scholar]
- Fiorelli M, Bastianello S, von Kummer R, del Zoppo GJ, Larrue V, Lesaffre E, Ringleb AP, Lorenzano S, Manelfe C and Bozzao L 1999. Hemorrhagic transformation within 36 h of a cerebral infarct: relationships with early clinical deterioration and 3-month outcome in the European cooperative acute stroke study I (ECASS I) cohort Stroke 30 2280–4 [DOI] [PubMed] [Google Scholar]
- Fujita H, Tsai DY, Itoh T, Doi K, Morishita J, Ueda K and Ohtsuka A 1992. A simple method for determining the modulation transfer function in digital radiography IEEE Trans. Med. Imaging 11 34–9 [DOI] [PubMed] [Google Scholar]
- Giersch J, Niederlohner D and Anton G 2004. The influence of energy weighting on x-ray imaging quality Nucl. Instrum. Meth. Phys. Res. A 531 68–74 [Google Scholar]
- Gonzalez RG, Hirsch JA, Lev MH, Schaefer PW and Schwamm LH (ed) 2011. Acute Ischemic Stroke–Imaging and Invervention 2nd edn (Berlin: Springer; ) [Google Scholar]
- Goodenough D, Weaver K, Davis D and LaFalce S 1982. Volume averaging limitations of computed tomography Am. J. Roentgenol 138 313–6 [DOI] [PubMed] [Google Scholar]
- Hamann E, Koenig T, Zuber M, Cecilia A, Tyazhev A, Tolbanov O, Procz S, Fauler A, Baumbach T and Fiederle M 2015. Performance of a Medipix3RX spectroscopic pixel detector with a high resistivity gallium arsenide sensor IEEE Trans. Med. Imaging 34 707–15 [DOI] [PubMed] [Google Scholar]
- Hanson KM 1979. Detectability in computed tomographic images Med. Phys 6 441–51 [DOI] [PubMed] [Google Scholar]
- Hart RG, Boop BS and Anderson DC 1995. Oral anticoagulants and intracranial hemorrhage Stroke 26 1471–7 [DOI] [PubMed] [Google Scholar]
- Hsieh J 2015. Computed Tomography: Principles, Design, Artifacts, and Recent Advances 3rd edn (Bellingham, WA: SPIE Optical Engineering Press; ) [Google Scholar]
- Ji X, Zhang R, Chen GH and Li K 2018. Impact of anti-charge sharing on the zero-frequency detective quantum efficiency of CdTe-based photon counting detector system: cascaded systems analysis and experimental validation Phys. Med. Biol 63 095003. [DOI] [PMC free article] [PubMed] [Google Scholar]
- Kalender WA 2011. Computed Tomography: Fundamentals, System Technology, Image Quality, Applications 3rd edn (New York: Wiley; ) [Google Scholar]
- Kalisz K, Buethe J, Saboo SS, Abbara S, Halliburton S and Rajiah P 2016. Artifacts at cardiac CT: physics and solutions RadioGraphics 36 2064–83 [DOI] [PubMed] [Google Scholar]
- Kidwell CS et al. 2004. Comparison of MRI and CT for detection of acute intracerebral hemorrhage JAMA 292 1823–30 [DOI] [PubMed] [Google Scholar]
- Kilic K, Erbas G, Guryildirim M, Arac M, Ilgit E and Coskun B 2011. Lowering the dose in head CT using adaptive statistical iterative reconstruction Am. J. Neuroradiol 32 1578–82 [DOI] [PMC free article] [PubMed] [Google Scholar]
- Knoll GF 2010. Radiation Detection and Measurement 4th edn (New York: Wiley; ) [Google Scholar]
- Leng S, Gutjahr R, Ferrero A, Kappler S, Henning A, Halaweish A, Zhou W, Montoya J and McCollough C 2017. Ultra-high spatial resolution multi-energy CT using photon counting detector technology Proc. SPIE 10132 101327. [DOI] [PMC free article] [PubMed] [Google Scholar]
- Leng S, Rajendran K, Gong H, Zhou W, Halaweish AF, Henning A, Kappler S, Baer M, Fletcher JG and McCollough CH 2018. 150-μm spatial resolution using photon-counting detector computed tomography technology: technical performance and first patient images Invest. Radiol 53 655. [DOI] [PMC free article] [PubMed] [Google Scholar]
- Leng S. et al. A high-resolution imaging technique using a whole-body, research photon counting detector CT system. Proc. SPIE. 2016;9783:97831I. doi: 10.1117/12.2217180. [DOI] [PMC free article] [PubMed] [Google Scholar]
- Li K, Bevins N, Zambelli J and Chen GH 2013. Fundamental relationship between the noise properties of grating-based differential phase contrast CT and absorption CT: theoretical framework using a cascaded system model and experimental validation Med. Phys 40 021908. [DOI] [PMC free article] [PubMed] [Google Scholar]
- Marchal J. Theoretical analysis of the effect of charge-sharing on the detective quantum efficiency of single-photon counting segmented silicon detectors. J. Instrum. 2010;5:P01004. [Google Scholar]
- Naidich TP, Castillo M, Cha S and Smirniotopoulos JG 2012. Imaging of the Brain: Expert Radiology Series 1st edn (Amsterdam: Elsevier; ) [Google Scholar]
- Nakada T and Kwee IL 1996. Computed tomographynegative acute thalamic hematoma J. Neuroimaging 6 119–21 [DOI] [PubMed] [Google Scholar]
- Nogueira RG et al. 2015. Predictors and clinical relevance of hemorrhagic transformation after endovascular therapy for anterior circulation large vessel occlusion strokes: a multicenter retrospective analysis of 1122 patients J. Neurointerv. Surg 7 16–21 [DOI] [PMC free article] [PubMed] [Google Scholar]
- Nowak G, Schwachenwald D, Schwachenwald R, Kehler U, Müller H and Arnold H 1998. Intracerebral hematomas caused by aneurysm rupture. Experience with 67 cases Neurosurg. Rev 21 5–9 [DOI] [PubMed] [Google Scholar]
- Osteras BH, Heggen KL, Pedersen HK, Andersen HK and Martinsen ACT 2016. Can use of adaptive statistical iterative reconstruction reduce radiation dose in unenhanced head CT? An analysis of qualitative and quantitative image quality Acta Radiol. Open 5 2058460116645831 [DOI] [PMC free article] [PubMed] [Google Scholar]
- Ozdoba C, Slotboom J, Schroth G, Ulzheimer S, Kottke R, Watzal H and Weisstanner C 2014. Dose reduction in standard head CT: first results from a new scanner using iterative reconstruction and a new detector type in comparison with two previous generations of multi-slice CT Clin. Neuroradiol 24 23–8 [DOI] [PMC free article] [PubMed] [Google Scholar]
- Packard S, Kase CA, Aly AS and Barest GD 2003. Computed tomography-negative intracerebral hemorrhage: case report and implications for management Arch. Neurol 60 1156–9 [DOI] [PubMed] [Google Scholar]
- Perel P, Roberts I, Bouamra O, Woodford M, Mooney J and Lecky F 2009. Intracranial bleeding in patients with traumatic brain injury: a prognostic study BMC Emerg. Med 9 15. [DOI] [PMC free article] [PubMed] [Google Scholar]
- Pourmorteza A, Symons R, Reich D, Bagheri M, Cork T, Kappler S, Ulzheimer S and Bluemke D 2017. Photon-counting CT of the brain: in vivo human results and image-quality assessment Am. J. Neuroradiol 38 2257–63 [DOI] [PMC free article] [PubMed] [Google Scholar]
- Prakash P, Zbijewski W, Gang GJ, Ding Y, Stayman JW, Yorkston J, Carrino JA and Siewerdsen JH 2011. Task-based modeling and optimization of a cone-beam CT scanner for musculoskeletal imaging Med. Phys 38 5612–29 [DOI] [PMC free article] [PubMed] [Google Scholar]
- Roessl E, Brendel B, Engel KJ, Schlomka JP, Thran A and Proksa R 2011. Sensitivity of photon-counting based K-edge imaging in x-ray computed tomography IEEE Trans. Med. Imaging 30 1678–90 [DOI] [PubMed] [Google Scholar]
- Roessl E and Proksa R 2007. K-edge imaging in x-ray computed tomography using multi-bin photon counting detectors Phys. Med. Biol 52 4679. [DOI] [PubMed] [Google Scholar]
- Samei E, Ikejimba LC, Harrawood BP, Rong J, Cunningham IA and Flynn MJ 2017. Report of AAPM task group 162: software for planar image quality metrology Med. Phys 45 e32–9 [DOI] [PubMed] [Google Scholar]
- Sandborg M and Carlsson GA 1992. Influence of x-ray energy spectrum, contrasting detail and detector on the signal-to-noise ratio (SNR) and detective quantum efficiency (DQE) in projection radiography Phys. Med. Biol 37 1245 [Google Scholar]
- Schmidt TG 2009. Optimal ‘image-based’ weighting for energy-resolved CT Med. Phys 36 3018–27 [DOI] [PubMed] [Google Scholar]
- Schmidt TG, Barber RF and Sidky EY 2017. A spectral CT method to directly estimate basis material maps from experimental photon-counting data IEEE Trans. Med. Imaging 36 1808–19 [DOI] [PMC free article] [PubMed] [Google Scholar]
- Sharp P. et al. Report 54. J. Int. Comm. Rad. Units Meas. 1996;os28:NP. [Google Scholar]
- Shikhaliev PM. Energy-resolved computed tomography: first experimental results. Phys. Med. Biol. 2008;53:5595. doi: 10.1088/0031-9155/53/20/002. [DOI] [PubMed] [Google Scholar]
- Shikhaliev PM and Fritz SG 2011. Photon counting spectral CT versus conventional CT: comparative evaluation for breast imaging application Phys. Med. Biol 56 1905. [DOI] [PubMed] [Google Scholar]
- Sisniega A. et al. Development and clinical translation of a cone-beam CT scanner for high-quality imaging of intracranial hemorrhage. Proc. SPIE. 2017;10132:101326. [Google Scholar]
- Sussman E and Connolly E Jr 2013. Hemorrhagic transformation: a review of the rate of hemorrhage in the major clinical trials of acute ischemic stroke Frontiers Neurol 4 69. [DOI] [PMC free article] [PubMed] [Google Scholar]
- Symons R, Krauss B, Sahbaee P, Cork TE, Lakshmanan MN, Bluemke DA and Pourmorteza A 2017. Photon-counting CT for simultaneous imaging of multiple contrast agents in the abdomen: an in vivo study Med. Phys 44 5120–7 [DOI] [PMC free article] [PubMed] [Google Scholar]
- Symons R, Reich D, Bagheri M, Cork TE, Krauss B, Ulzheimer S, Kappler S, Bluemke DA and Pourmorteza A 2018. Photon-counting computed tomography for vascular imaging of the head and neck: first in vivo human results Invest. Radiol 53 135–42 [DOI] [PMC free article] [PubMed] [Google Scholar]
- Taguchi K, Itoh T, Fuld M, Fournie E, Lee O and Noguchi K 2018. ‘X-map 2.0’ for edema signal enhancement for acute ischemic stroke using non-contrast-enhanced dual-energy computed tomography Investigative Radiol 53 432. [DOI] [PubMed] [Google Scholar]
- Taguchi K and Iwanczyk JS 2013. Vision 20/20: single photon counting x-ray detectors in medical imaging Med. Phys 40 100901. [DOI] [PMC free article] [PubMed] [Google Scholar]
- Tapiovaara MJ and Wagner R 1985. SNR and DQE analysis of broad spectrum x-ray imaging Phys. Med. Biol 30 519 [Google Scholar]
- Tward DJ and Siewerdsen JH 2008. Cascaded systems analysis of the 3D noise transfer characteristics of flat-panel cone-beam CT Med. Phys 35 5510–29 [DOI] [PMC free article] [PubMed] [Google Scholar]
- Tward DJ and Siewerdsen JH 2009. Noise aliasing and the 3D NEQ of flat-panel cone-beam CT: effect of 2D/3D apertures and sampling Med. Phys 36 3830–43 [DOI] [PMC free article] [PubMed] [Google Scholar]
- Wagner RF and Brown DG 1985. Unified SNR analysis of medical imaging systems Phys. Med. Biol 30 489. [DOI] [PMC free article] [PubMed] [Google Scholar]
- Wang AS and Pelc NJ 2011. Sufficient statistics as a generalization of binning in spectral x-ray imaging IEEE Trans. Med. Imaging 30 84–93 [DOI] [PubMed] [Google Scholar]
- Xu J et al. 2016. Technical assessment of a prototype cone beam CT system for imaging of acute intracranial hemorrhage Med. Phys 43 5745–57 [DOI] [PubMed] [Google Scholar]
- Xu J, Zbijewski W, Gang G, Stayman JW, Taguchi K, Lundqvist M, Fredenberg E, Carrino JA and Siewerdsen JH 2014. Cascaded systems analysis of photon counting detectors Med. Phys 41 101907. [DOI] [PMC free article] [PubMed] [Google Scholar]
- Yu Z. et al. Evaluation of conventional imaging performance in a research whole-body CT system with a photon-counting detector array. Phys. Med. Biol. 2016;61:1572. doi: 10.1088/0031-9155/61/4/1572. [DOI] [PMC free article] [PubMed] [Google Scholar]


