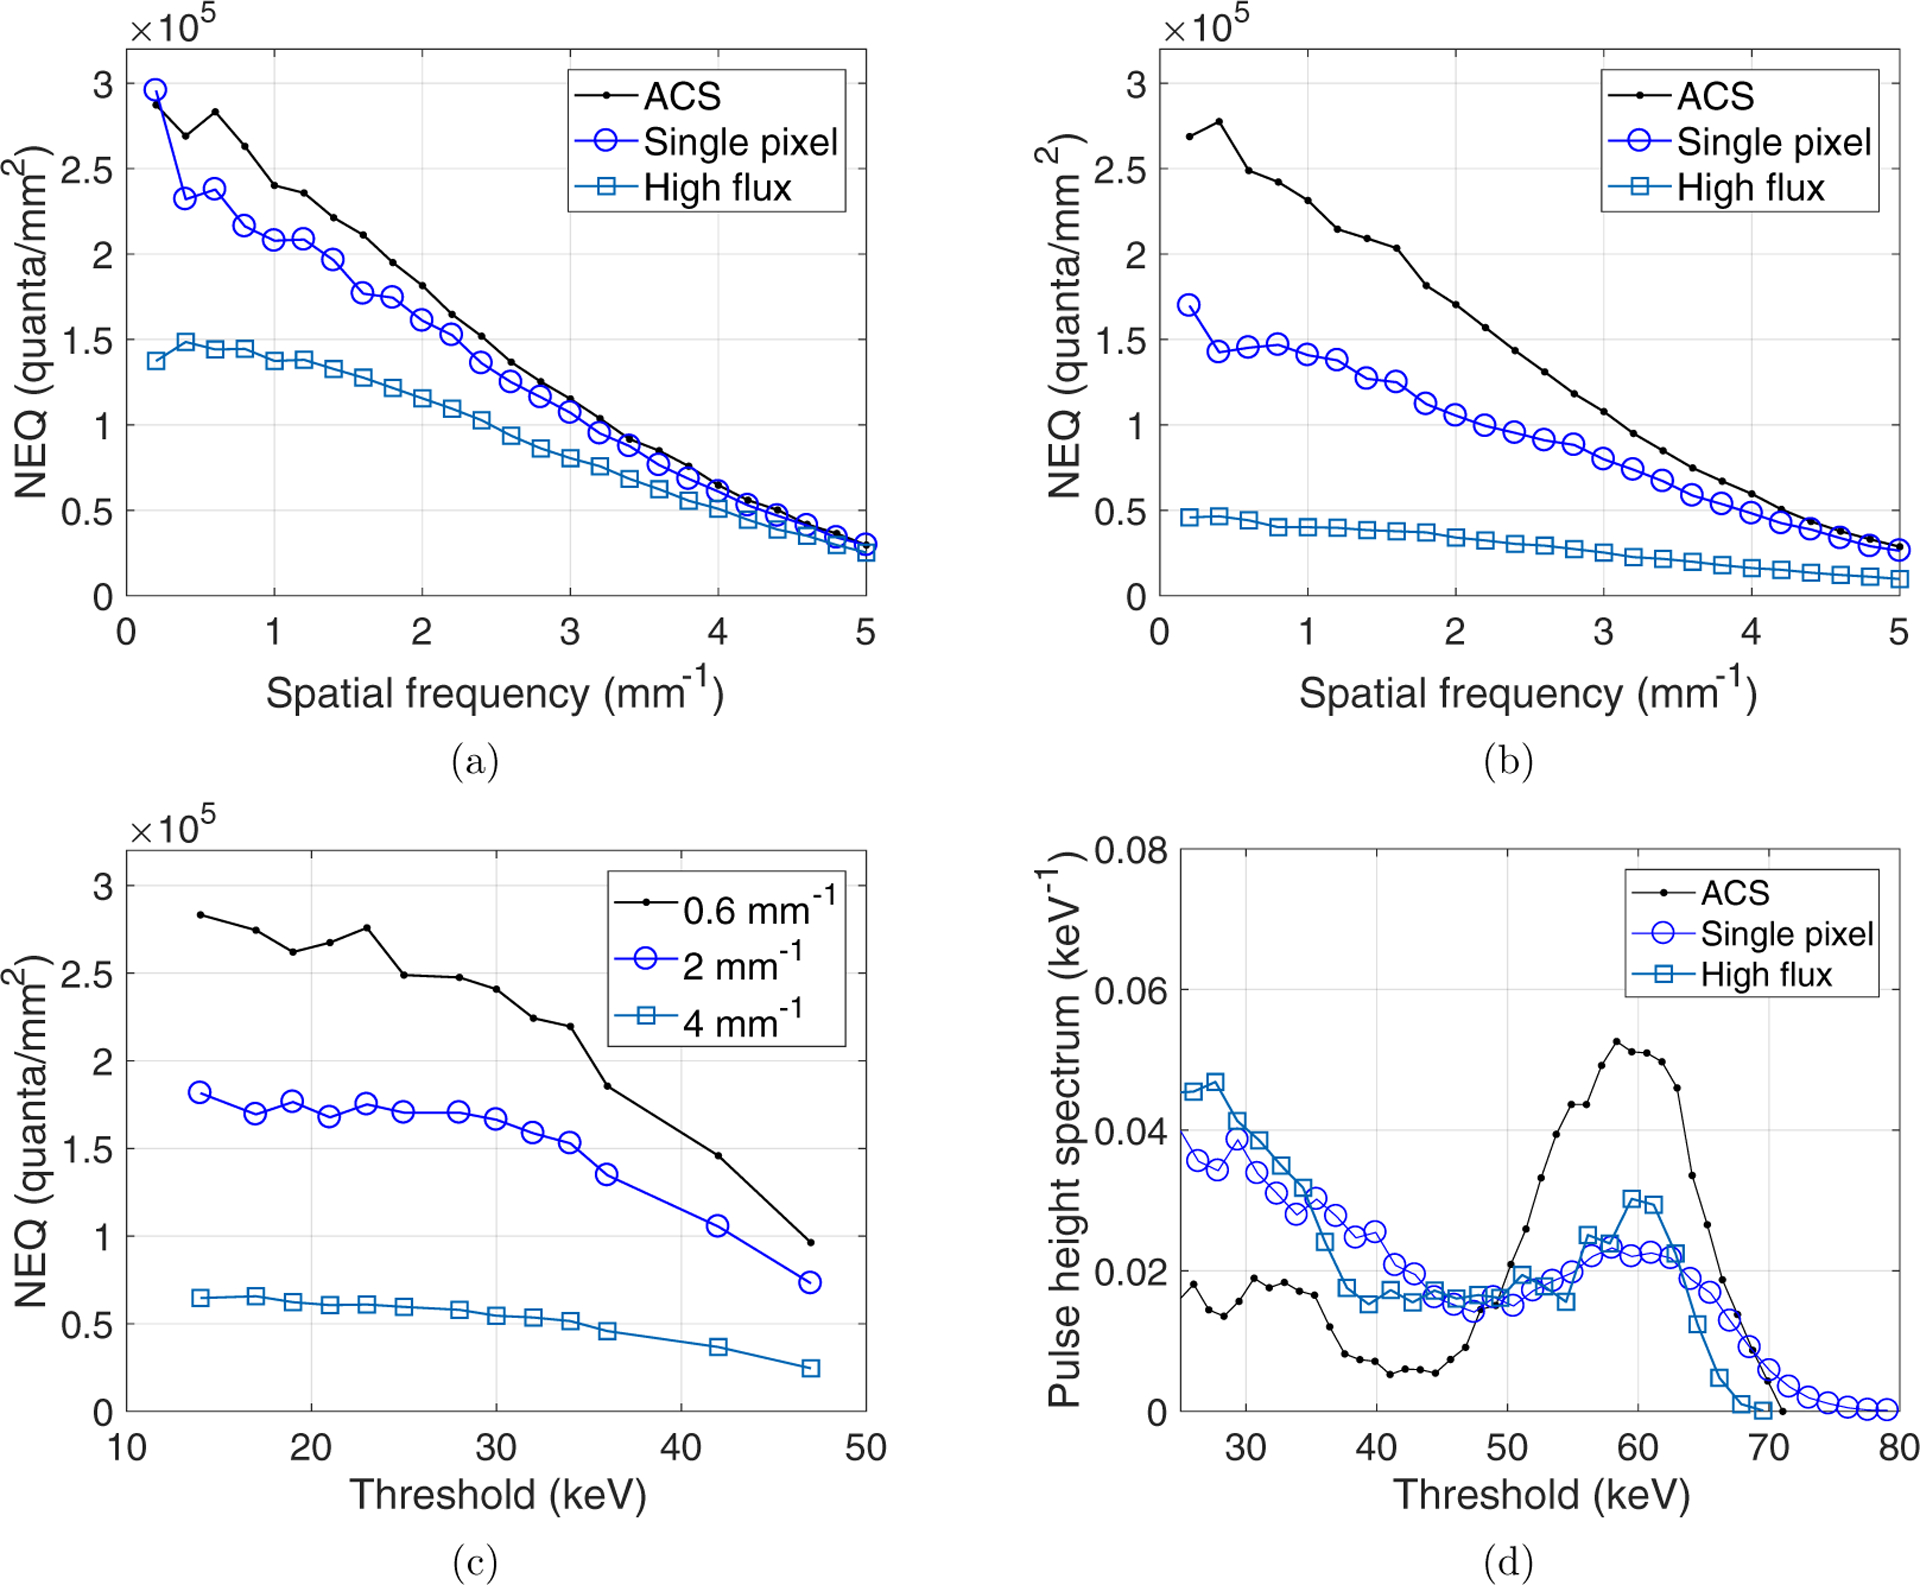
Figure 4.

(a) Comparison of NEQ(k) curves of the PCD system measured at three detection modes and the lowest energy threshold level (15 keV). (b) NEQ(k) curves of the three detection modes measured at a higher energy threshold level (25 keV). (c) Dependence of NEQ(k) of the ACS mode on the energy threshold levels. (d) Pulse height spectra of the three PCD detection modes measured using an americium-241 source.
