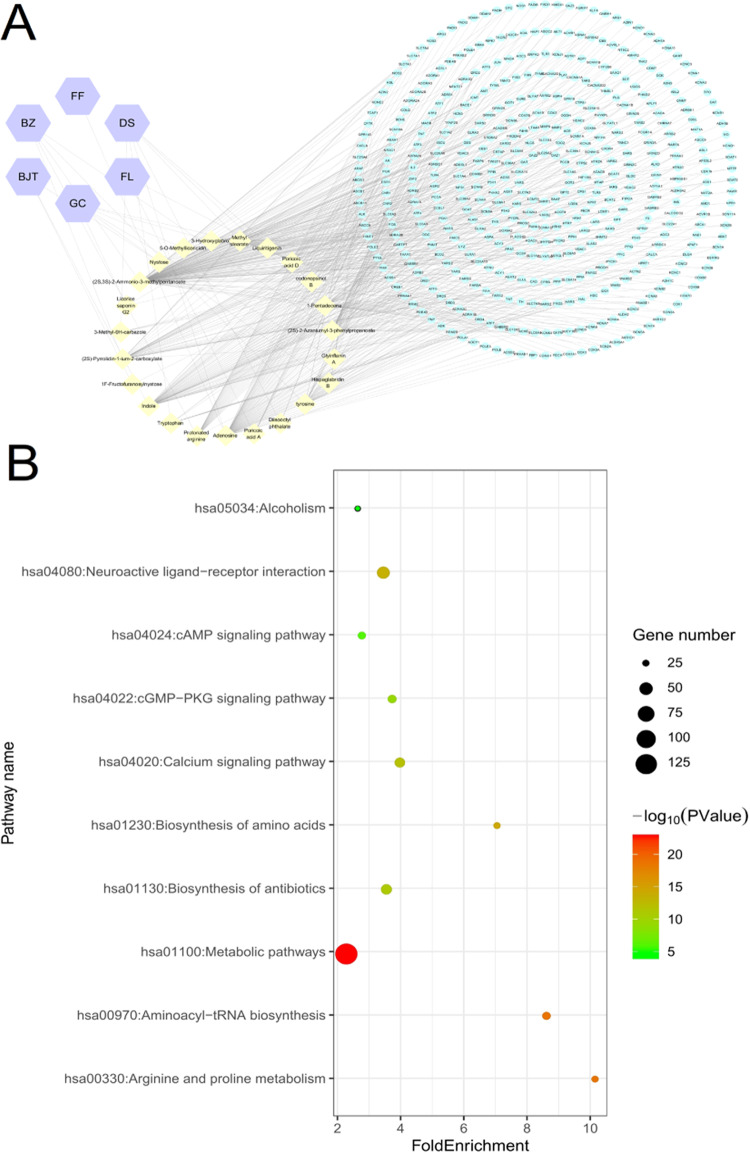
Figure 3.
Potential targets and pathway analysis. (A) Pharmacological network. Purple hexagon: herbal medicine; yellow diamond: components; green oval: targets. (B) Top 10 pathways. The area of the dot indicates the number of enriched genes; the larger the dot, the more the number of genes. The color of the dot represents the significance of P-value; the pathway with intense red color indicates a significant P-value.

