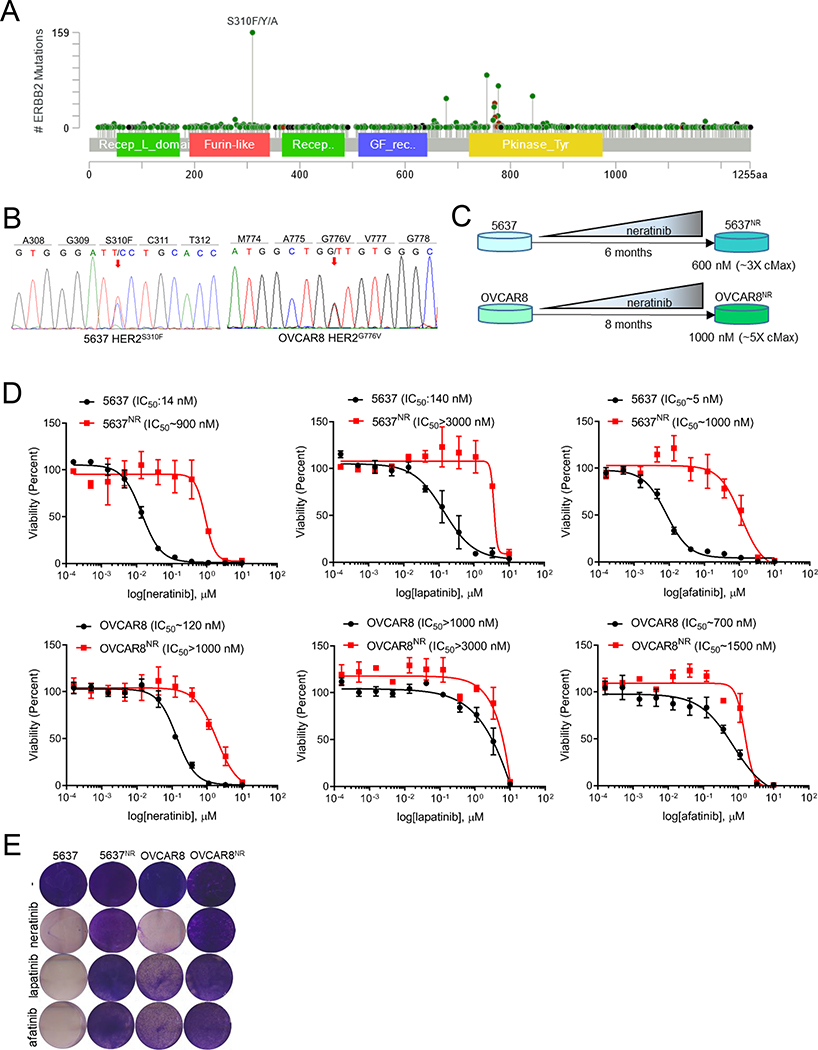
Fig. 1. Generation and characterization of HER2-mutant cells with acquired resistance to neratinib.
(A) Lollipop plot showing prevalence of different HER2 mutations in 1,488 samples queried across 53,929 tumors (cBioPortal). (B) Electropherograms of HER2 cDNA depicting gain-of-function mutations in 5637 and OVCAR8 cells. (C) Schematic representation of generation of neratinib-resistant 5637 and OVCAR8 cell lines. (D) 12-point dose response curves of parental and neratinib-resistant 5637 and OVCAR8 cells treated with neratinib, lapatinib or afatinib. After 6 days of treatment, cells were counted on a Coulter counter. Each data point represents the percent cell viability relative to vehicle-treated controls. Shown are the mean viability ± SEM from at least two independent experiments. (E) Images of crystal violet stained monolayers of parental and neratinib-resistant 5637 and OVCAR8 cells seeded in 12-well plates and treated with HER2 TKIs (1 μM). See also Figure S1.

