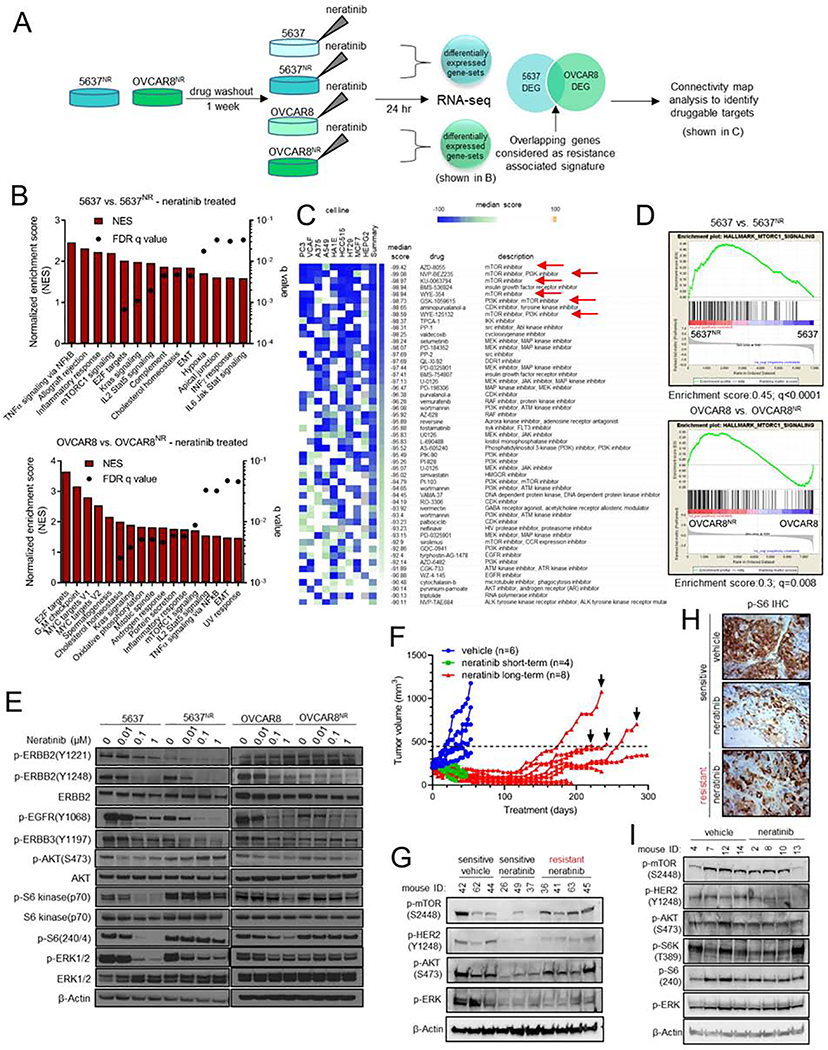
Fig. 2. The TORC1 pathway is hyperactivated in neratinib resistant HER2-mutant cells.
(A) Schema of RNA-seq analysis of parental and neratinib-resistant 5637 and OVCAR8 cells. (B) RNA-seq based gene set enrichment analysis (GSEA) of pathways significantly upregulated in parental vs. neratinib-resistant cells, both in the presence of neratinib. (C) Connectivity map analysis to identify drugs that could potentially reverse expression of resistance associated genes. mTOR inhibitors are highlighted with red arrows. (D) Enrichment plots for genes associated with TORC1 activation in parental vs. neratinib-resistant cells, both in the presence of neratinib. (E) Immunoblots of parental and neratinib-resistant 5637 and OVCAR8 cells treated with increasing concentrations of neratinib. After treatment for 24 hr, whole cell lysates were prepared and subjected to immunoblot analyses with the indicated antibodies. (F) Generation of neratinib-resistant ST1616B (HER2-amplified, HER2D769Y) breast cancer PDXs as described in the STAR Methods. Mice with established ST1616B tumors were treated with vehicle (blue) or neratinib (40 mg/kg; green/red). Four sensitive (green) and resistant (black arrows) tumors were harvested for molecular analyses. (G) Immunoblot analysis of neratinib-sensitive and -resistant ST1616B PDXs harvested 2 hr after the last drug treatment. (H) Representative P-S6 IHC images of tumors from (F), scale bar = 50 μm. (I) Immunoblots of vehicle- and neratinib-treated de novo resistant ST1456B (HER2V8421) breast cancer PDXs. Tumors were harvested 1–2 hr after the last drug treatment. See also Figure S2.

