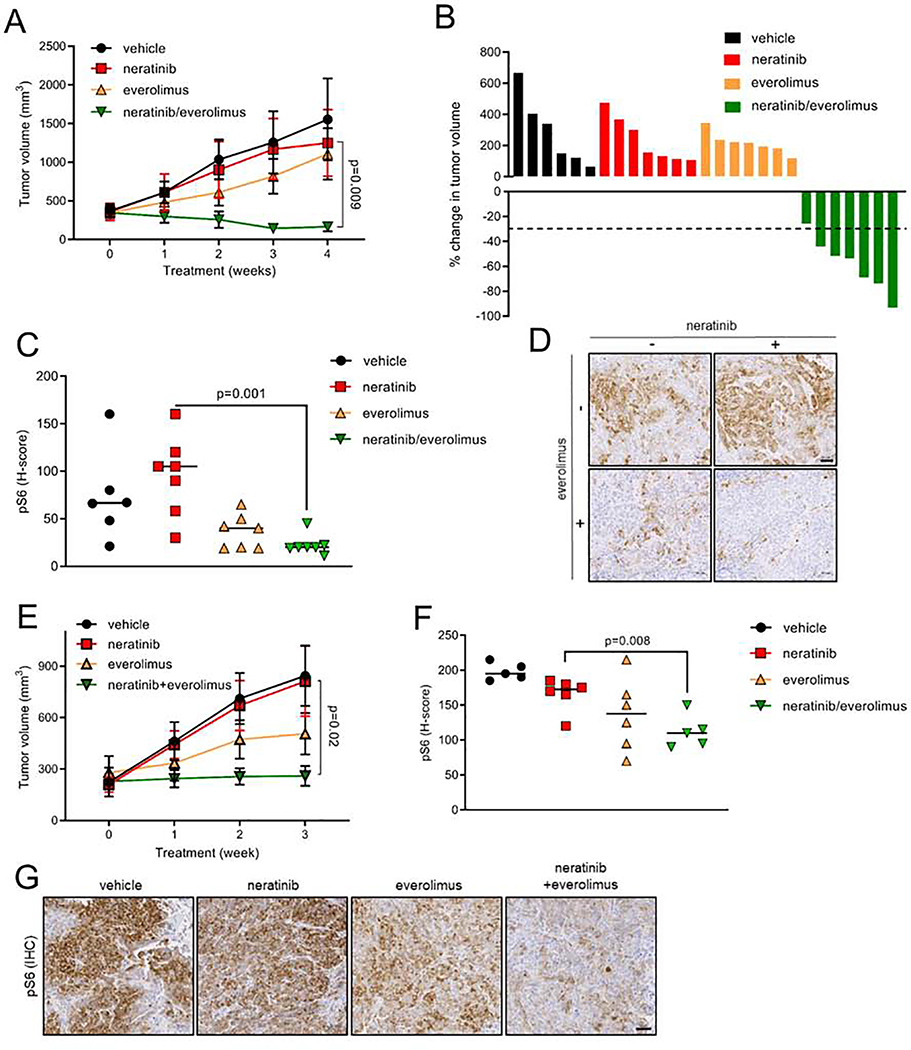
Fig. 4. Neratinib in combination with everolimus suppresses growth of established neratinib-resistant HER2-mutant xenografts.
(A) Growth of 5637NR tumors treated with vehicle, neratinib (40 mg/kg), everolimus (5 mg/kg) or both drugs. Each data point represents mean tumor volume in mm3 ± SEM (n≥6 mice per arm), Student’s t-test. (B) Percent change in volume of individual 5637NR tumors in each treatment arm shown in (A). (C) H-score quantification (described in STAR Methods) of P-S6 levels in 5637nr tumors shown in (A). Horizontal line indicates the median, Student’s t-test. (D) Representative images from (C), scale bar = 50 μm. (E) Growth of established OVCAR8nr xenografts treated with vehicle, neratinib (40 mg/kg), everolimus (5 mg/kg) or both drugs. Each data point represents mean tumor volume in mm ± SEM (n≥5 mice per group), Student’s t-test. (F) P-S6 H-scores based on IHC analysis of OVCAR8 tumors shown in (E). Horizontal line indicates the median, Student’s t-test. (G) Representative images from (F), scale bar = 50 μm. See also Figure S4.

