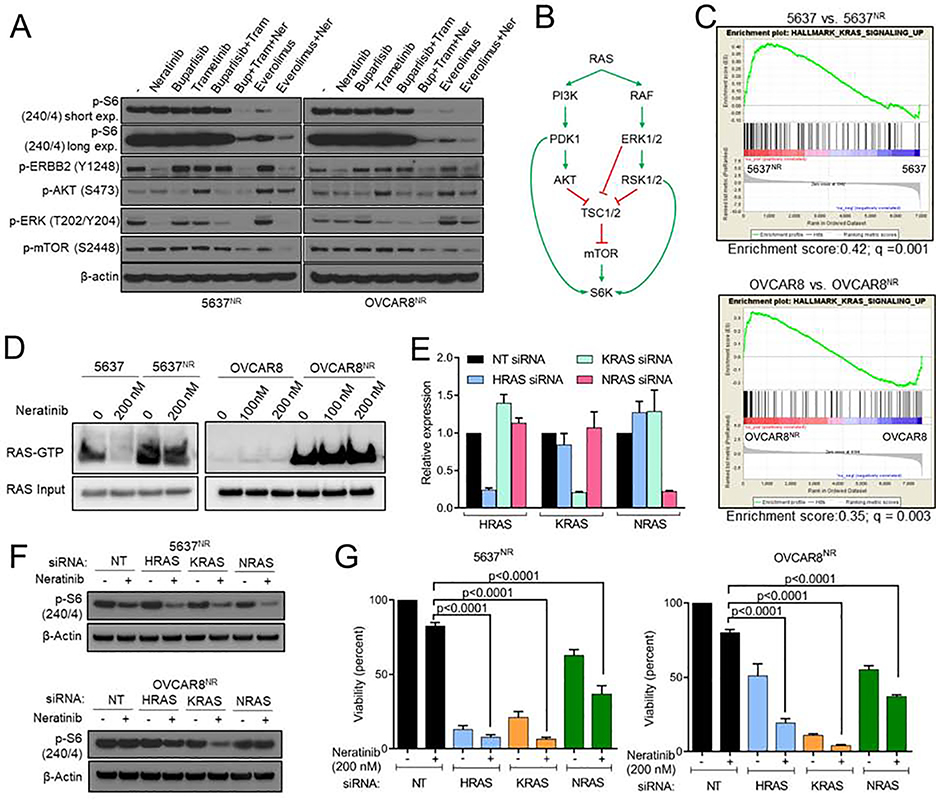
Fig. 5. RAS hyperactivity is associated with increased TORC1 activity and may mediate neratinib resistance.
(A) Immunoblot analysis of 5637NR and OVCAR8NR cells treated for 24 hr with neratinib, buparlisib, trametinib or everolimus. (B) Schematic representation of RAS-mediated TORC1 activation. (C) Enrichment plots for RAS pathway related genes in neratinib treated parental cells vs. neratinib-resistant cells. (D) Active-RAS pulldown assay in parental and neratinib resistant 5637 and OVCAR8 cells treated with neratinib for 6 hr. (E) mRNA levels by qPCR of RAS isoforms in 5637NR cells ± siRNAs against HRAS, KRAS and NRAS. Values are mean ± SEM from three independent experiments. (F) Immunoblots of neratinib treated 5637NR and OVCAR8nr cells transfected with siRNAs against HRAS, KRAS and NRAS. (G) Growth assay of neratinib treated cells transfected with the indicated siRNAs. Values are mean ± SEM from three independent experiments, one-way ANOVA. See also Figure S5.

