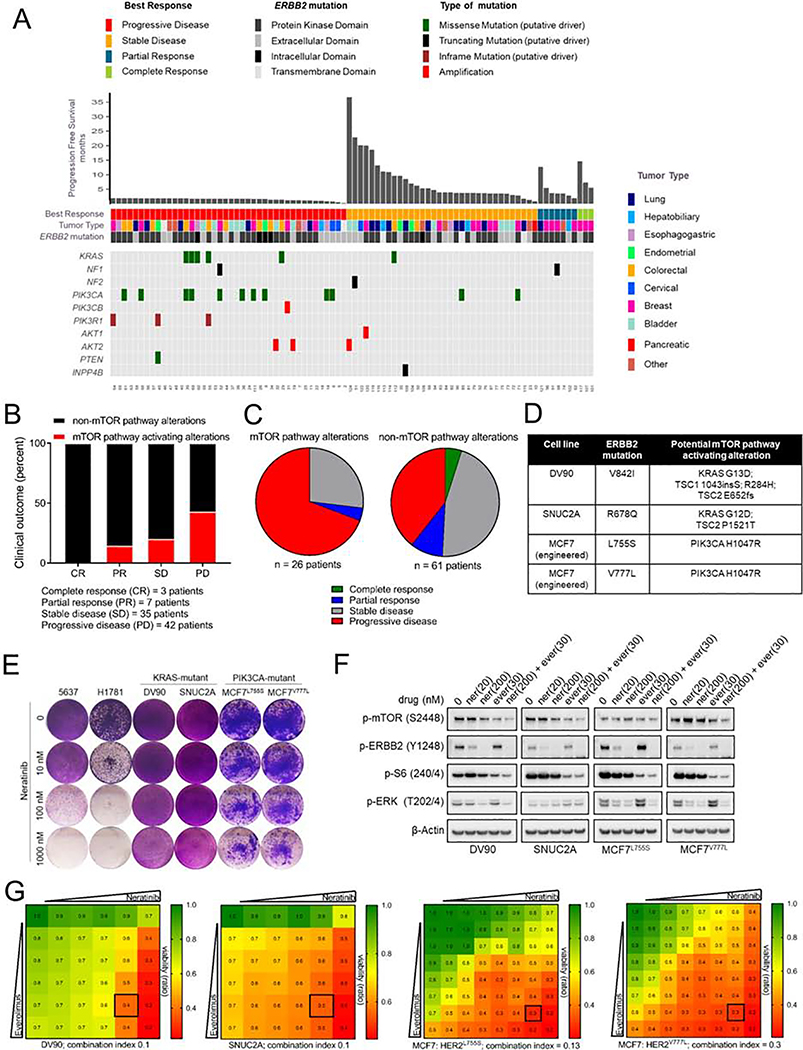
Fig. 6. mTOR pathway activating co-mutations in HER2-mutant cancers are associated with clinical resistance to neratinib.
(A-C) Clinical outcome of patients enrolled in the SUMMIT trial of neratinib based on mTOR pathway-associated alterations in their tumors; depicted as a tile plot (A), percent distribution (B), and pie-chart (C), [cBioPortal SUMMIT (Nature 2018)]. Mutations were classified as ‘mTOR activating alterations’ or ‘non-mTOR pathway alterations’ as described in the STAR Methods and Table S1. (D) Mutation status of HER2 and other key cancer genes in HER2-mutant cell lines. (E) Crystal violet stained monolayers of 5637, H1781, DV90, SNUC2A, MCF7L755S and MCF7V777L cells seeded in 12-well plates and treated with the indicated concentrations of neratinib. Cell monolayers were stained and imaged when vehicle-treated controls reached ~90% confluency. (F) Immunoblot analysis of DV90, SNUC2A, MCF7L755S and MCF7V777L cells treated with indicated concentrations of neratinib, everolimus or both drugs for 24 hr. (G) Viability assay to test synergy between neratinib and everolimus. Cells were treated with increasing concentrations of each drug alone or both every 72 hr until vehicle-treated controls reached ~90% confluency. Cell monolayers were then stained with crystal violet; staining intensities were quantified colorimetrically and combination indices were determined using the Chou-Talalay test. Numbers inside each box indicate the ratio of viable treated cells to untreated cells, from three independent experiments. See also Figure S6 and Table S1.

