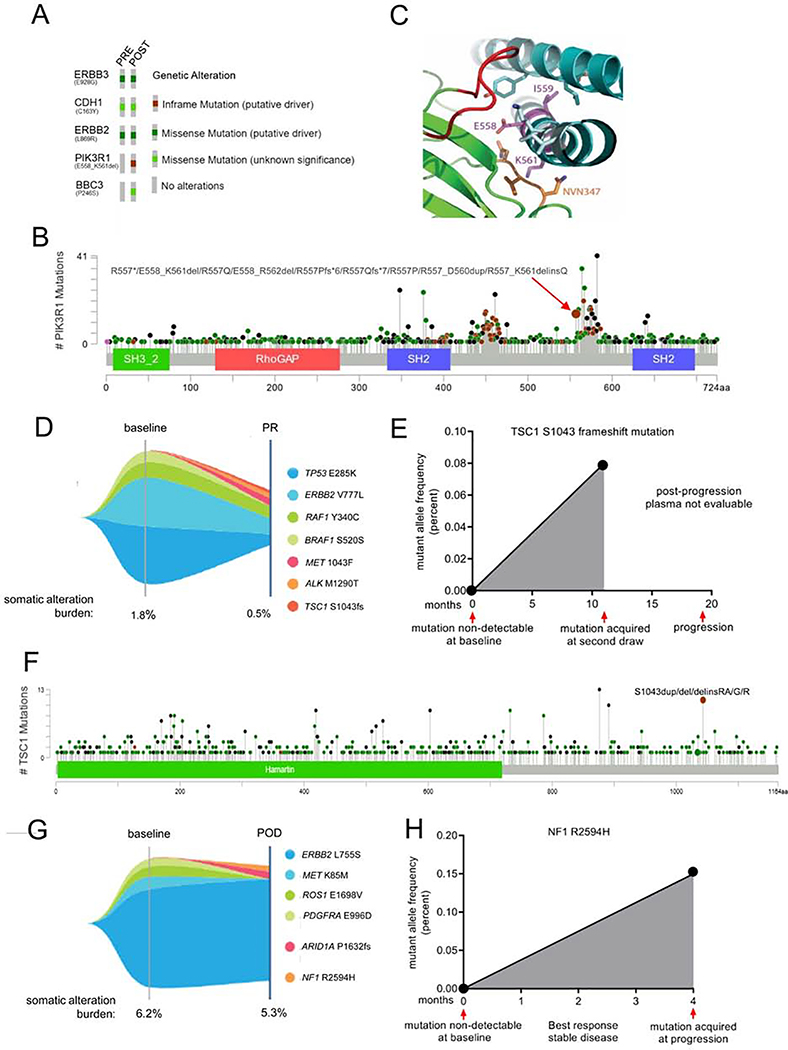
Fig. 7. Acquired mTOR pathway mutations in patients progressing on neratinib.
(A) Oncoprint of mutations detected by targeted capture NGS of archival primary tumor and a skin metastasis biopsied at the time of progression on neratinib. (B) Lollipop plot depicting the prevalence of PIK3R1 mutations queried in 1,599 patients’ tumors in cBioPortal. (C) Structure of PIK3R1 iSH2 (cyan ribbon) bound to PIK3CA (green ribbon). Amino acid residues 558–561 (deleted in PIK3R1 558–561 del; EIDK, shown as magenta sticks) lie within the iSH2 helical domain of PIK3R1 (PDB: 4ovu). E558 and I559 residues interact with the neighboring PIK3R1 helix (cyan stick), and K561 interacts with the C2 domain loop of PIK3CA (345-NVN-347, orange stick). PIK3R1 residues that are C-terminal to the deleted region (light cyan stick) interact with residues from another PIK3CA C2 loop (red). (D) Tumor mutations identified by NGS of plasma cfDNA in a patient with breast cancer treated with neratinib for 11 months. Partial response denoted as PR. (E) Variant allele fraction of TSC1s1043 frame-shift mutation in plasma cfDNA at baseline and during the course of neratinib treatment. (F) Lollipop plot of TSC1 mutations queried in 1168 samples in cBioPortal. (G) Tumor mutations identified by NGS of plasma cfDNA in a patient with breast cancer that developed acquired resistance to neratinib. Progressive disease denoted as POD. (H) Variant allele fraction of NF1R259A at baseline and at disease progression on treatment. See also Figure S7.

