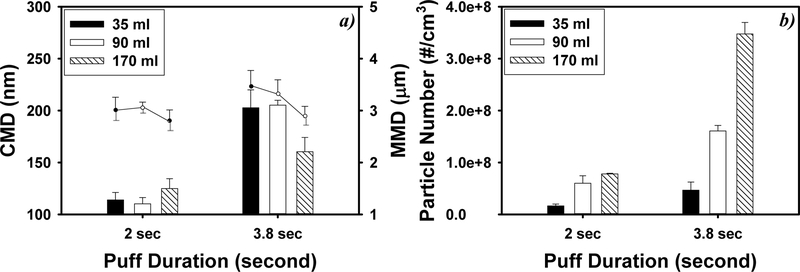
Figure 5.
Impact of vaping topography on e-cigarette particle count median diameters (CMD, nm, bar plots) and mass median diameters (MMD, μm, dot plots) (a) and particle counts (b). Particles were generated under 6.4 W e-cigarette battery power output and VG-based e-liquid with 12 mg/mL nicotine (N = 5; error bars are standard deviations of the 5 independent measurements).

