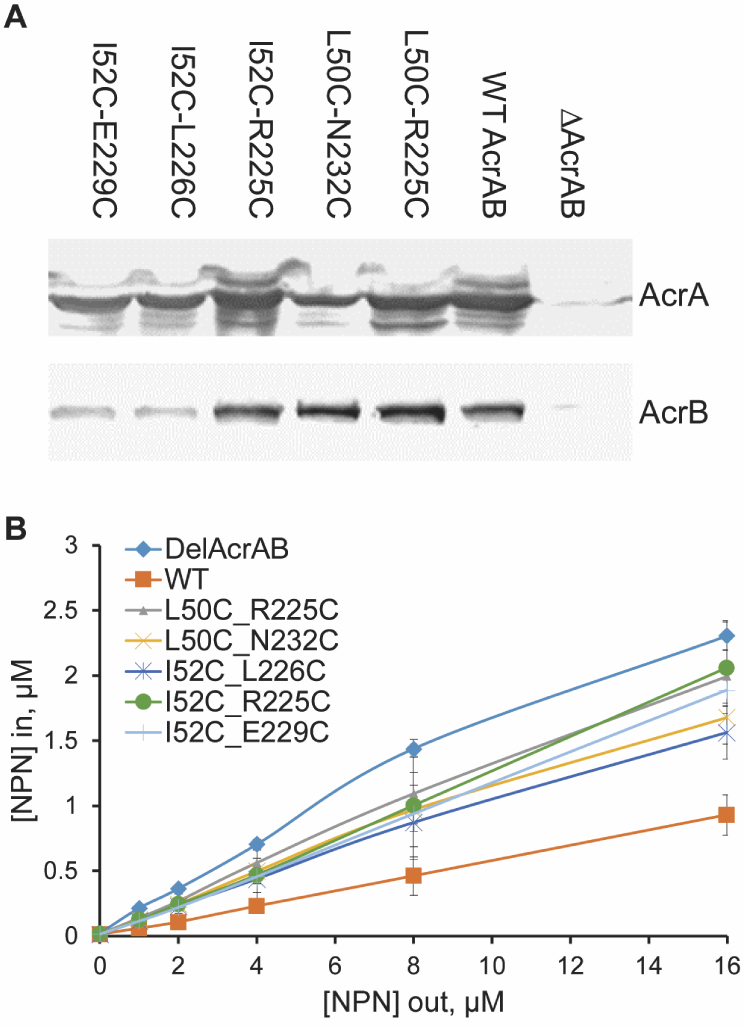
Figure 4: Expression and function of AcrA variants integrated into the chromosome of E. coli ΔAcrAB(Pore) cells.

(A) Immunoblotting of whole cell extracts of ΔAcrAB(Pore) cells producing the indicated AcrA variants with anti-AcrA (top panel) and anti-AcrB (bottom panel) antibodies. (B) Concentration dependence curves of the intracellular accumulation of the fluorescent probe NPN in ΔAcrAB(Pore) cells producing the indicated AcrA variants. Cells were incubated with increasing concentrations of NPN and the changes in fluorescence intensities monitored as a function of time. The collected kinetic data were converted into concentrations and fitted into an exponential uptake model to extract the steady-state intracellular concentrations of NPN.25 The calculated intracellular concentrations ([NPN]in) are plotted as a function of the external concentration of NPN ([NPN]out). The averages of two experiments are shown.
