
Figure 4.
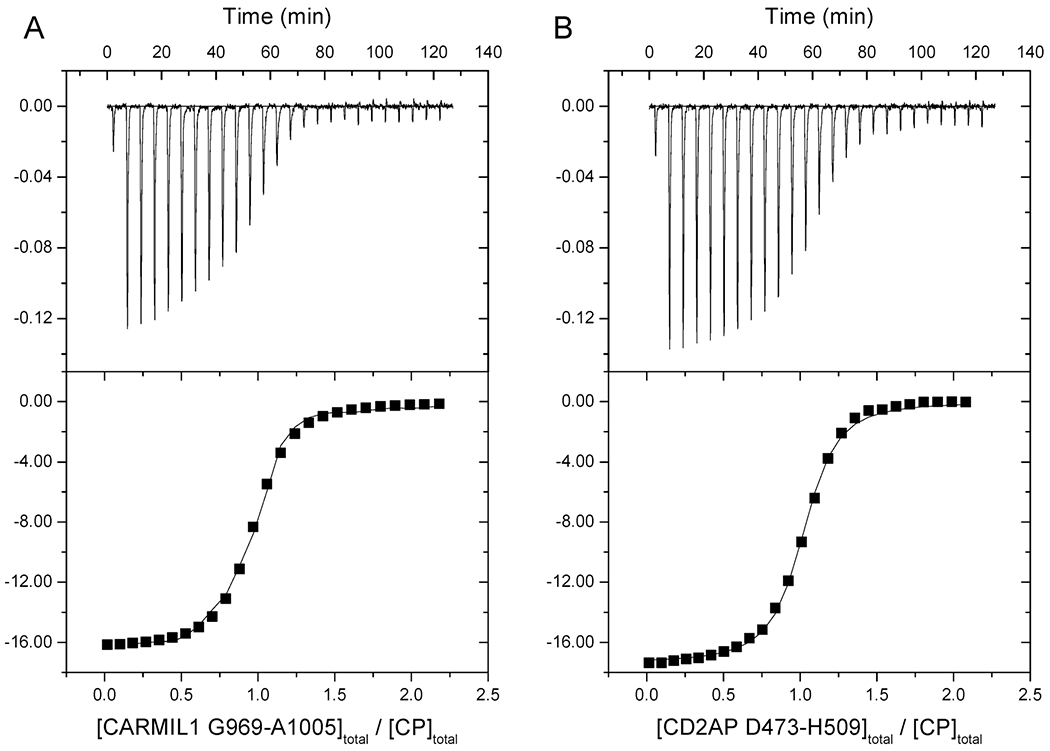
ITC of CPI-motif peptides binding to CP. Two representative examples are shown. The top panels show titration of CPI-motif peptides into CP with raw data plotted as the heat signal vs time. In the bottom panels, smooth curves show the best fit of the data to a single-site binding model. (A) Titration of CARMIL1 into CP: N = 0.946 ± 0.006, Kd = 27 ± 1 nM, ΔH° = −16.4 ± 0.2 kcal/mol, and TΔS° = −6.1 kcal/mol. (B) Titration of CD2AP into CP: N = 0.993 ± 0.004, Kd = 23 ± 2 nM, ΔH° = −17.4 ± 0.1 kcal/mol, and TΔS° = −6.9 kcal/mol.