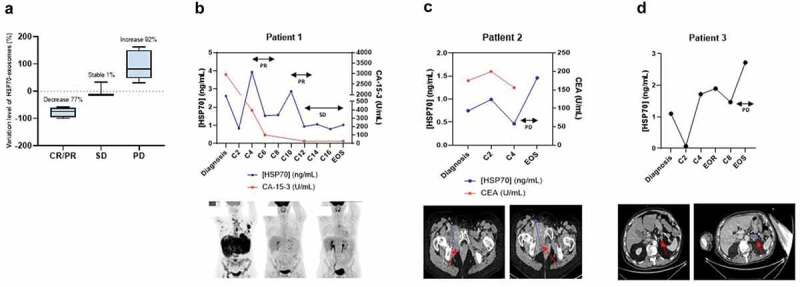
Figure 3.

Exosome HSP70 levels correlates with the response to treatment. (a) Exosomal HSP70 variation ratio between diagnosis and the first tumour evaluation according to the clinical status. CR/PR = Complete/Partial response (n = 6), SD = Stable disease (n = 3), PD = Progression disease (n = 11), p = 0.0043. (b)–(d): Case study of the correlation between HSP70 levels in exosomes (blue lines) and their response to the different cures (C2, C4, etc.). CA-15-3 and CEA clinical tumour marker measurements, when available, are indicated by a red line. EOR = End of radiotherapy, EOS = End of study, SD = Stable Diseased PD = Progression disease, PR = Partial response. Panels below show the respective scan imagery. Metastasis is visualised by black spots (patient 1) and red arrows (patients 2 and 3).
