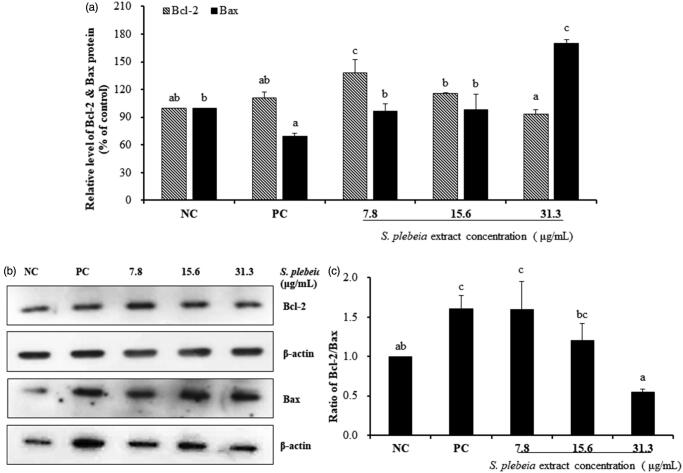
Figure 6.
The effect of S. plebeia extract on the expression of Bcl-2 and Bax proteins in hDPCs analysed by western blot. (a) Graph of protein expression; (b) The protein level of Bcl-2 and Bax; (c) The ratio of Bcl-2/Bax. The data shown are mean ± SD (n = 3). Values with different superscripts are significantly different at p < 0.05 by Duncan’s multiple range test. NC: negative control of hDPCs treated with DMEM; PC: positive control of hDPCs treated with 10 μM minoxidil.

