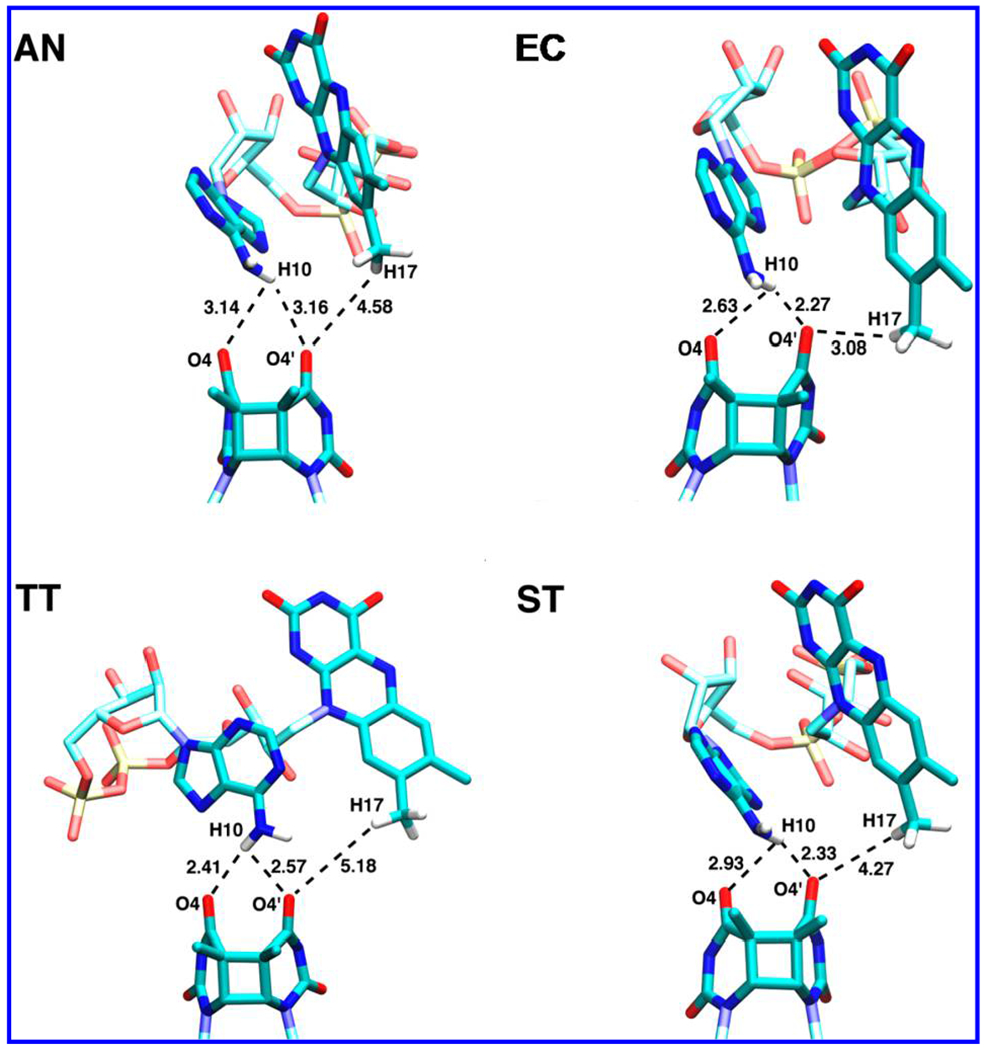
Figure 3.

Docked FADH−–CPD conformations used in the ET study: the structures of the photolyase–CPD complex in E. coli (EC) from ref 25, and the crystal structures produced by our docking protocol for A. nidulans (AN), T. thermophilus (TT), and S. tokodaii (ST). Only the hydrogen atoms at the FADH−–CPD interface are shown in this picture.
