
FIG. 1.
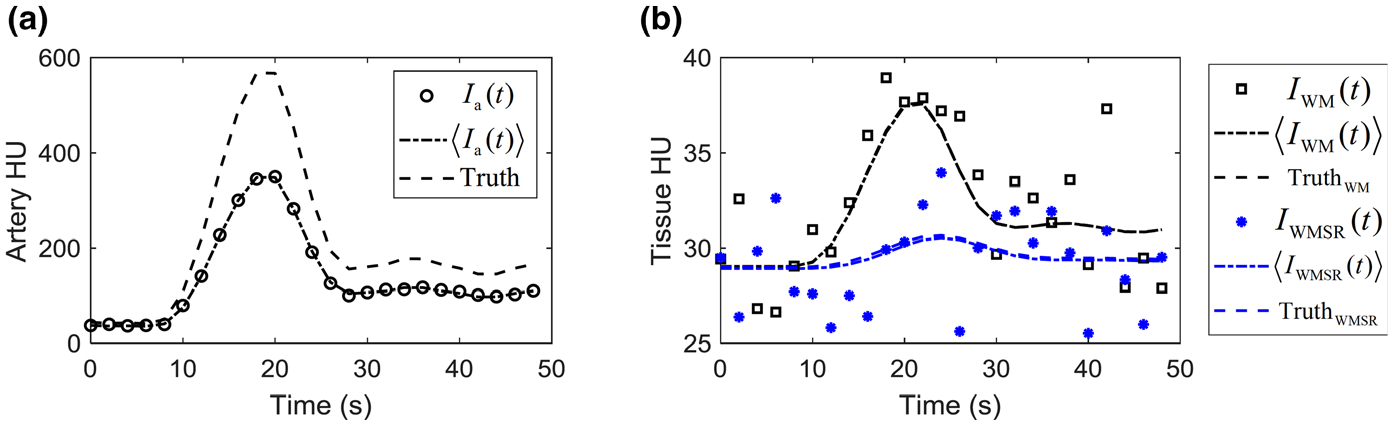
Artery (a) and tissue (b) enhancement curves of the digital phantom. The ground truth curves [ and ] were shown as dashed lines. The expected CT signal (〈Ia(t)〉 and 〈I(t)〉) are shown as dash-dotted lines, and a single set of their noisy realizations is also included. WM: white matter; WMSR: white matter with severely reduced blood flow.