
FIG. 2.
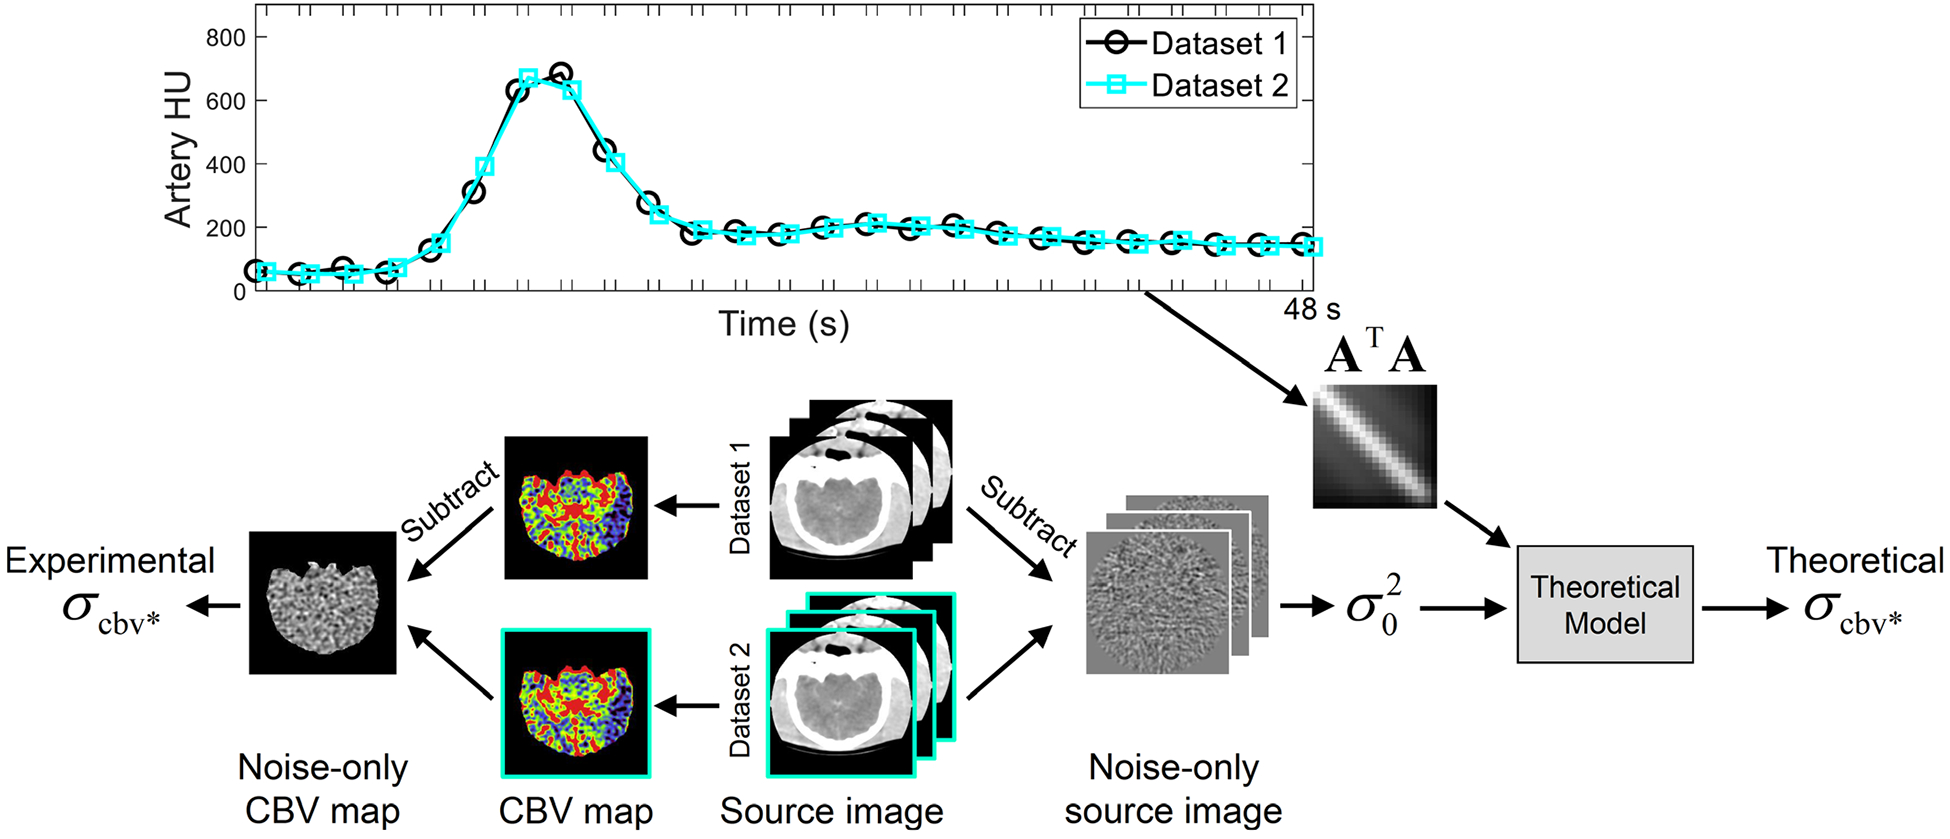
Workflow for the canine subject-based validation study. The top figure illustrates the time sequence of canine computed tomography perfusion source image acquisition: each frame in Dataset 1 was accompanied by an extra scan, providing a Dataset 2 to facilitate noise measurements. Based on the arterial attenuation curve shown in the top figure, matrix A⊤A was constructed and fed to the theoretical model to calculate . Meanwhile, the two source image datasets produced two sets of CBV maps, from which was experimentally measured.