
FIG. 8.
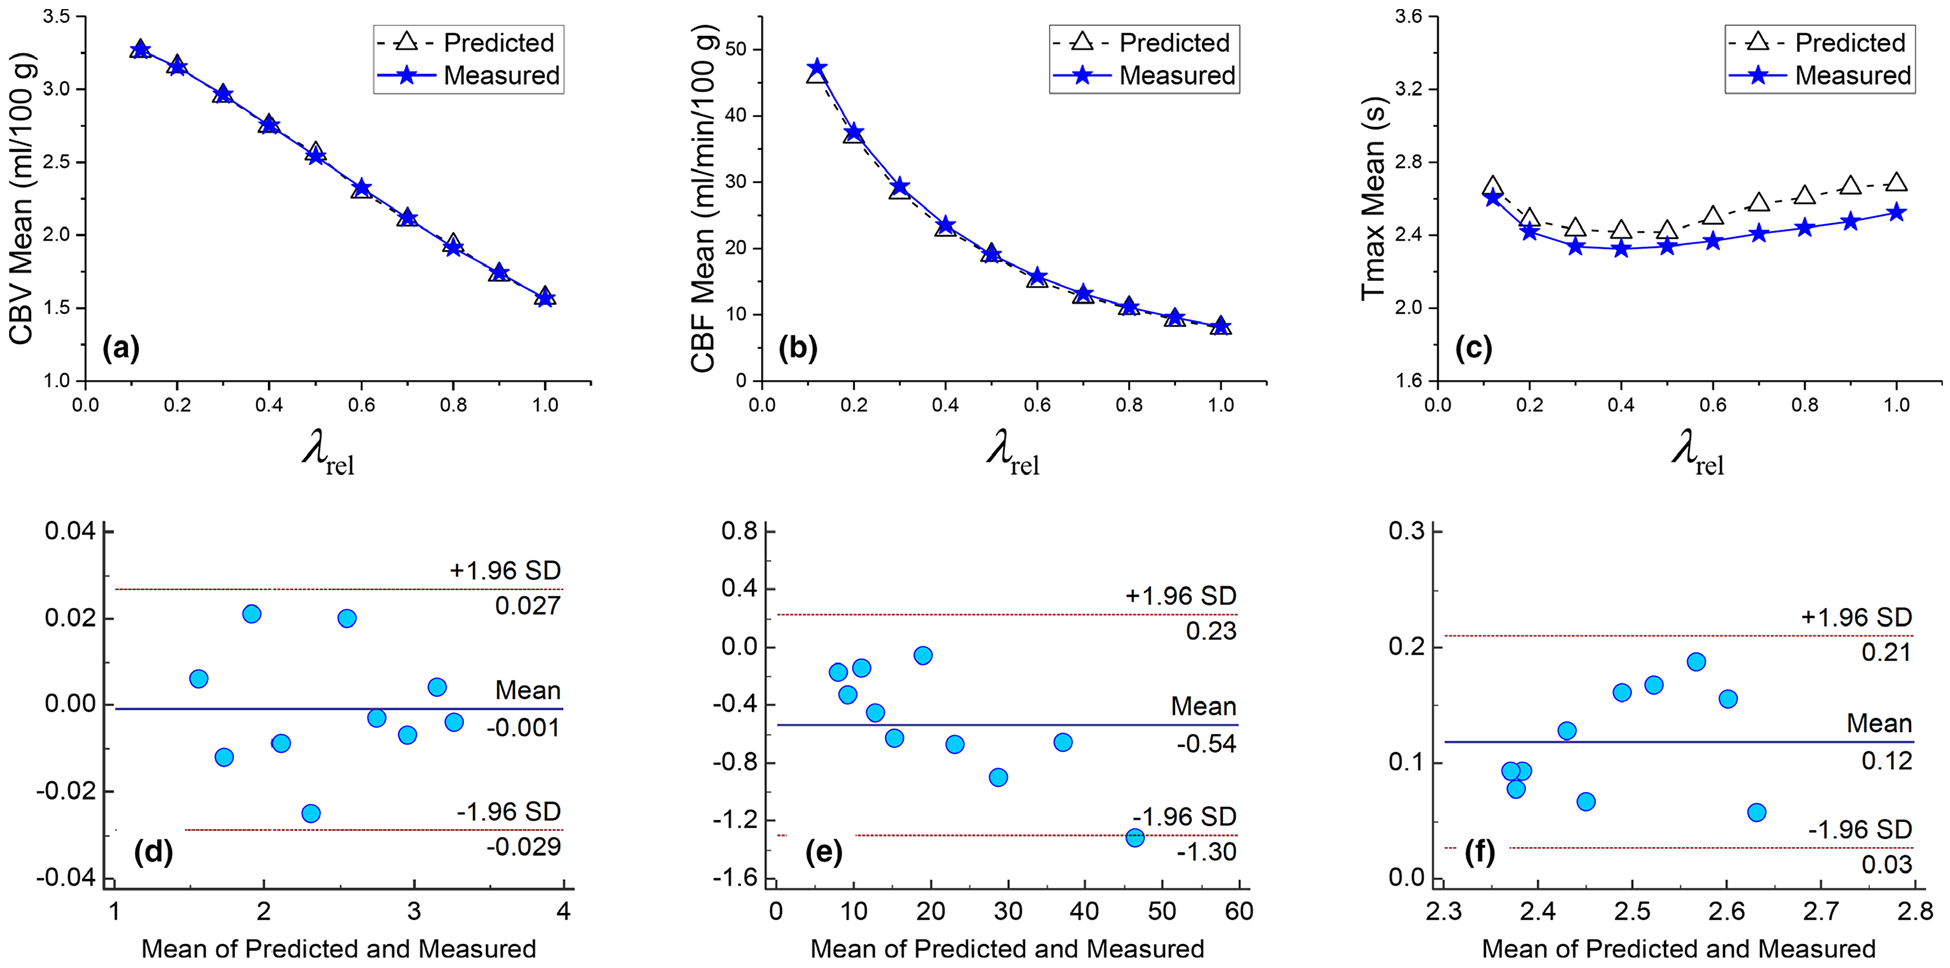
Comparison of measured and theoretically calculated (a), (b), and (c) for gray matter in the digital phantom. The corresponding Bland–Altman plots are shown in (d), (e), and (f), respectively. The ground truth values of cerebral blood volume, cerebral blood flow, and tmax are 3.3 ml/100 g, 53 ml/min/100 g, and 0 s, respectively. SD: standard deviation.