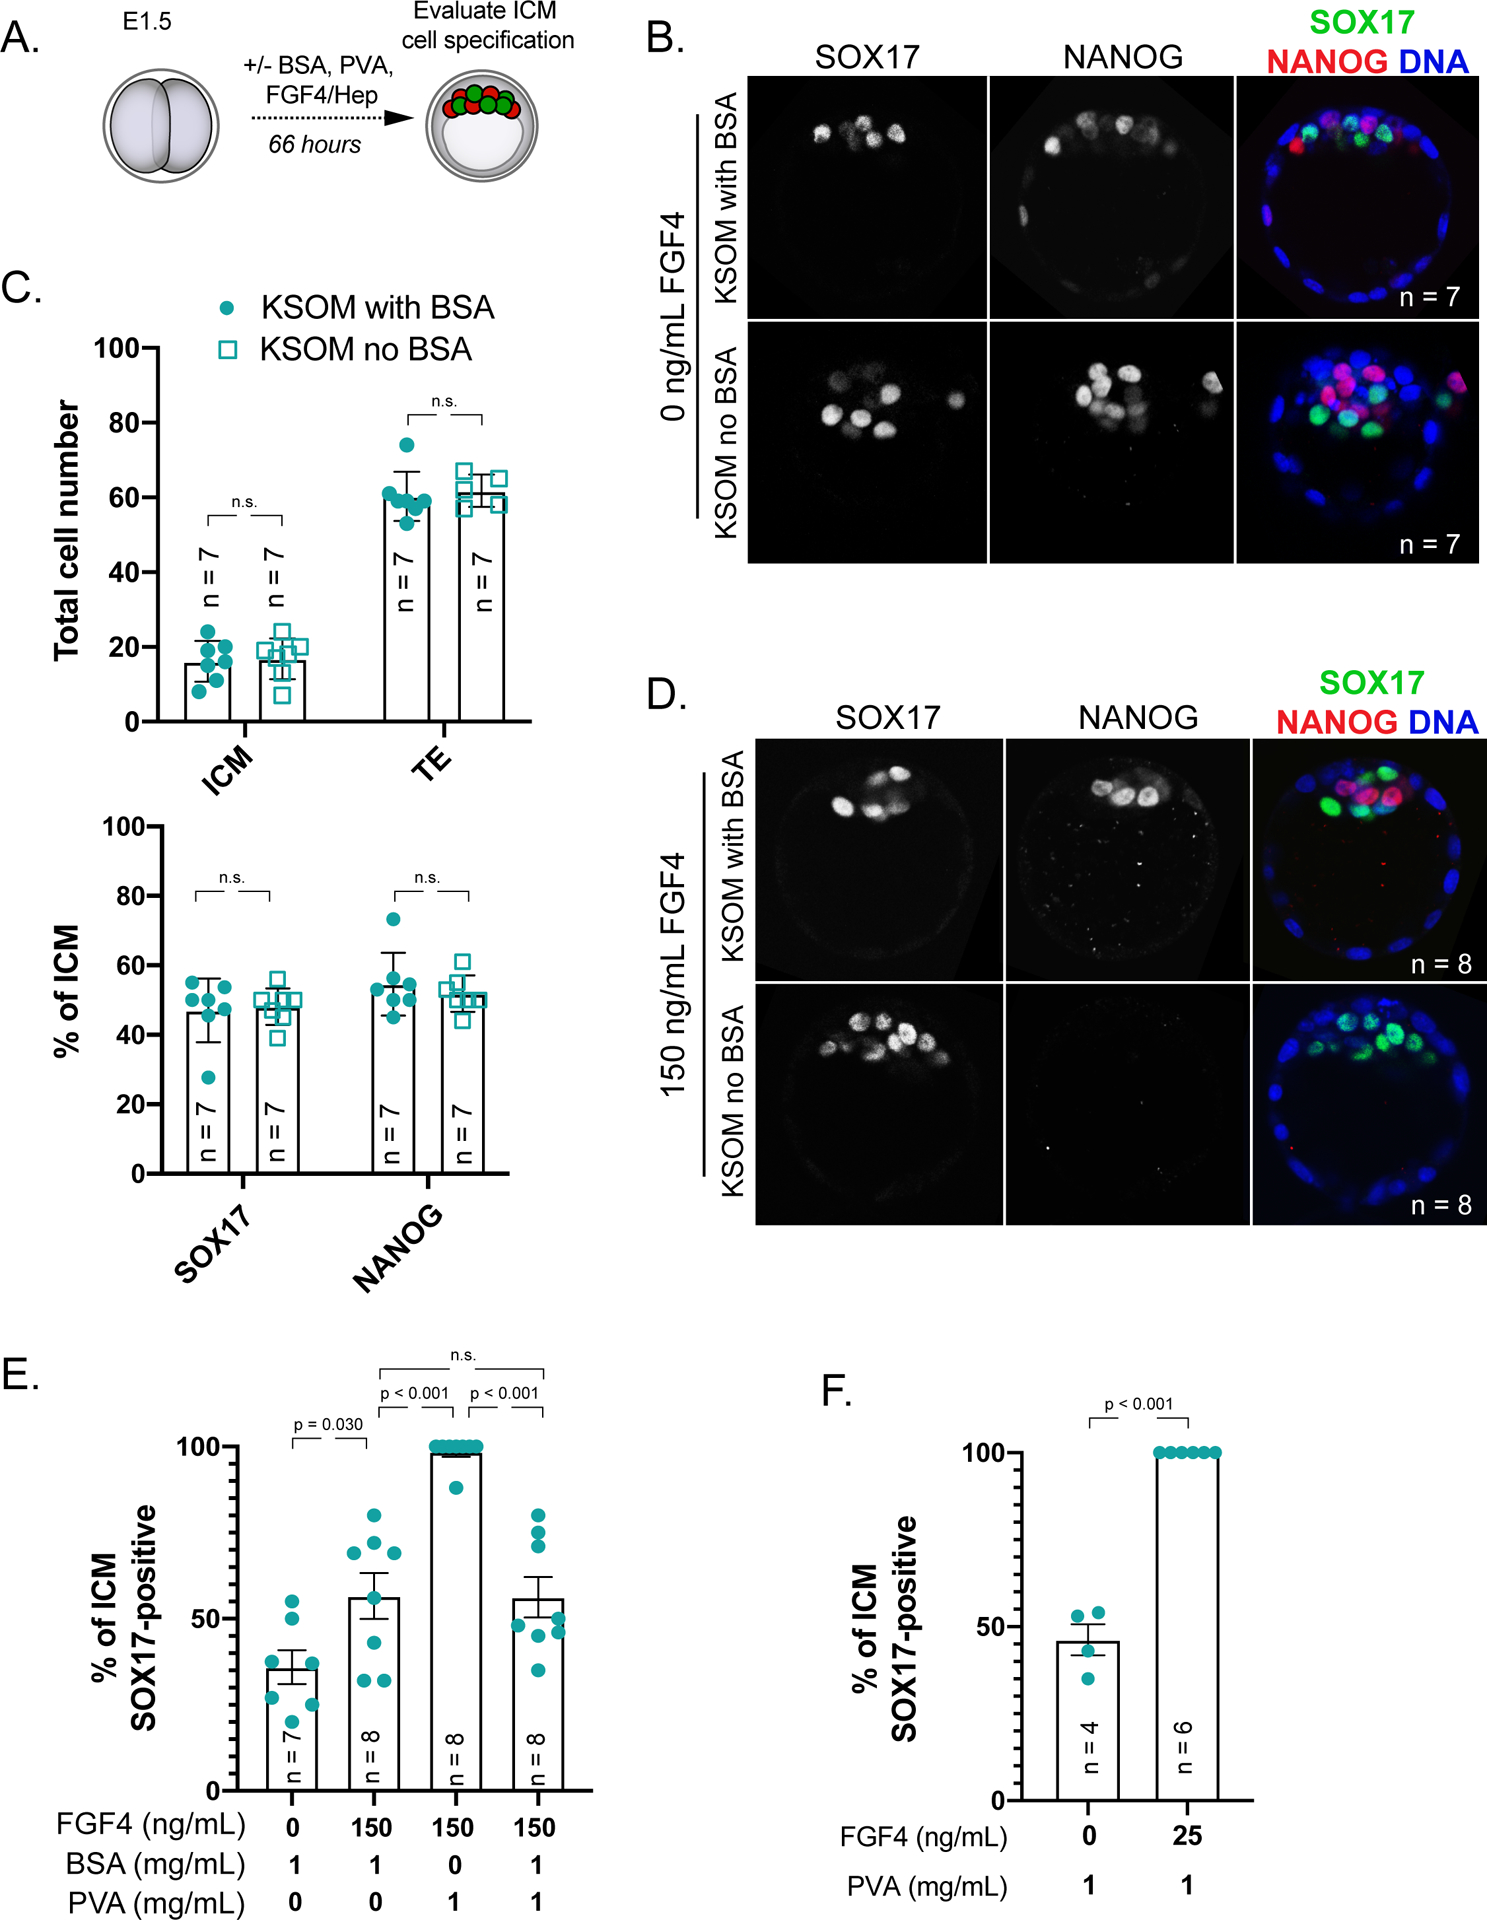
Figure 1. BSA antagonizes signaling by exogenous FGF4.

A) Experimental design for embryos shown and analyzed in this figure. Red = NANOG indicative of epiblast cell fate, green = SOX17 indicative of primitive endoderm cell fate.
B) Immunostaining for SOX17 to identify primitive endoderm (PE) cells and NANOG to identify epiblast (EPI) cells in embryos cultured for 66 hours starting from 2-cell stage in KSOM with 1 mg/mL BSA or without BSA (Millipore-Sigma MR-121-D and MR-107-D, respectively), but with 1 mg/mL added PVA (Sigma 360627). n = number of embryos examined. p = Student’s t-test. n.s. = not significant (p > 0.2).
C) Quantification of the total inner cell mass (ICM) and trophectoderm (TE) cells in embryos cultured in indicated conditions and proportion of ICM cells contributing to PE and EPI in these embryos. Each symbol represents a single embryo, column = mean, and error bars = standard deviations. p = Student’s t-test. n.s. = not significant (p > 0.2).
D) Immunostaining for SOX17 and NANOG in embryos cultured in KSOM + 150 ng/mL FGF4 (R&D Systems 235-F4–025) and 1 μg/mL Heparin (Sigma H3149) in the presence or absence of 1 mg/mL BSA. Each symbol represents a single embryo, column = mean, and error bars = standard deviations. p = Student’s t-test. n.s. = not significant (p > 0.2).
E) Quantification of lineage specification in embryos cultured in conditions indicated. Each symbol represents a single embryo, column = mean, and error bars = standard deviations.
F) Response of embryos cultured in KSOM without 1 mg/mL BSA to low dose of exogenous FGF4 and 1 μg/mL Heparin. Each symbol represents a single embryo, column = mean, and error bars = standard deviations. p = Student’s t-test.
