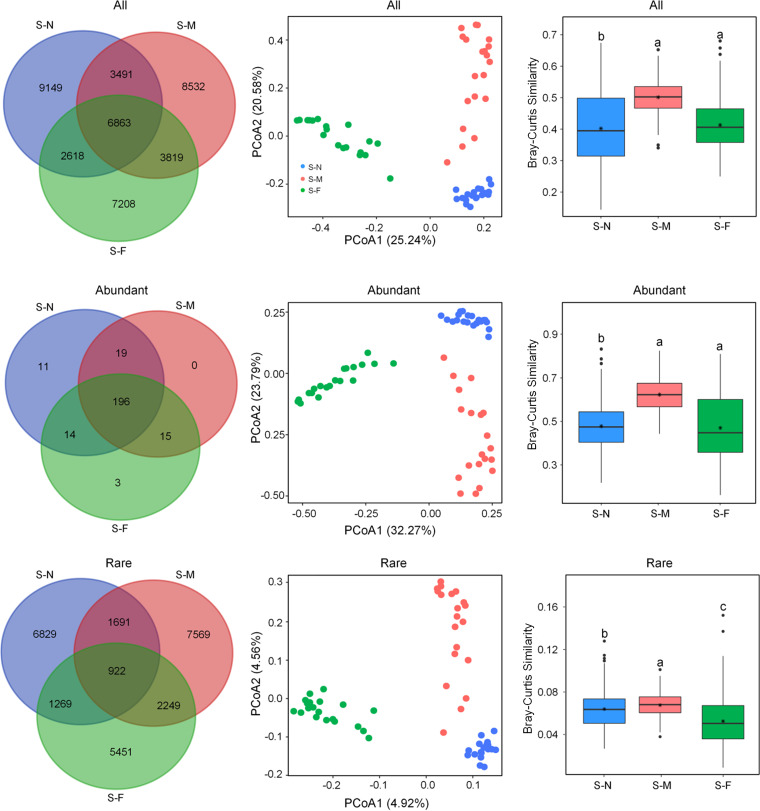
FIG 1.
Community structure of bacterial communities across the three transects. See Table 1 for transect details. (a) Venn diagram displaying the numbers of unique and shared OTUs between the three transects. (b) Principal-coordinate analysis (PCoA) of bacterial communities based on Bray-Curtis distances. (c) The pairwise Bray-Curtis dissimilarity of bacterial communities across different points. Different letters above bars indicate significant differences (P < 0.05) according to the nonparametric Mann-Whitney U test.

