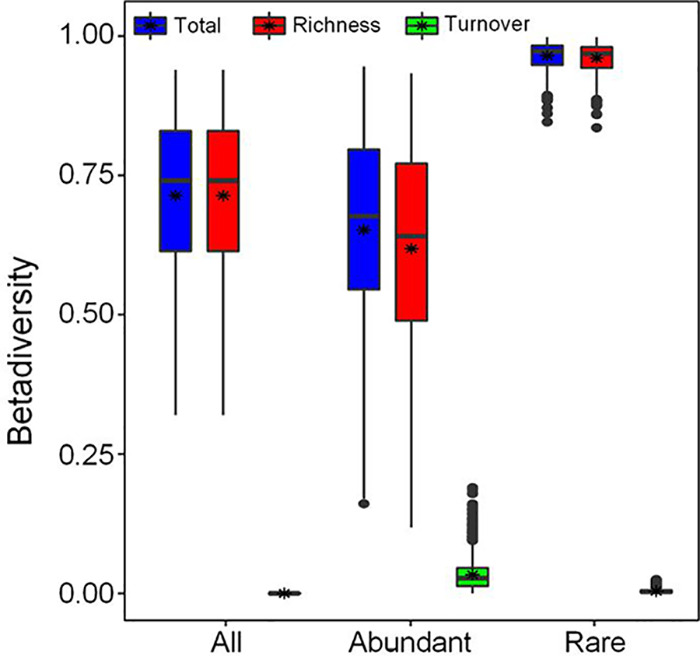
FIG 3.

The contribution of community turnover and OTU richness to the β-diversity patterns of the entire community, the abundant biosphere, and the rare biosphere, respectively. The top and bottom boundaries of each box indicate the 75th and 25th quartile values, and lines within each box represent the median values; asterisks (*) indicate mean values.
