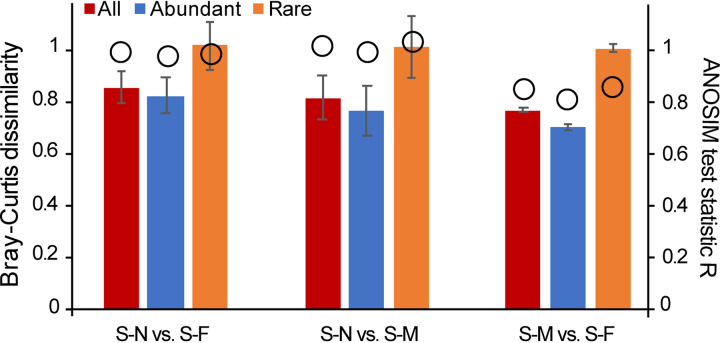
FIG 4.
Analysis of similarity (ANOSIM) and dissimilarity of the entire community and of the abundant and the rare biospheres across the three transects. See Table 1 for transect details. Significant values were determined at a P value of <0.05. The ANOSIM R and P values were calculated based on the Bray-Curtis dissimilarity matrices. Data are shown as means ± standard deviation (SD).

