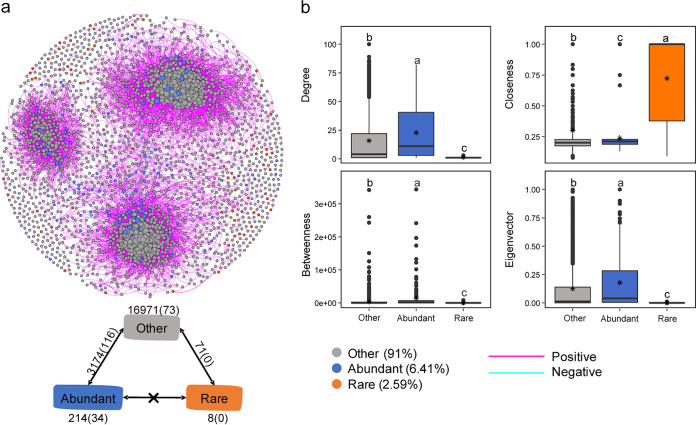
FIG 5.
Properties of the correlation-based network. (a) Networks analysis showing the intra-associations within each subcommunity and the interassociations between different subcommunities. A connection stands for a strong (Spearman’s ρ > 0.8 or ρ < −0.8) and significant (P < 0.01) correlation. The size of each node is proportional to the number of connections (i.e., degree). Numbers around each rectangle and each two-way arrow represent the inner associations of each subcommunity, and the remaining numbers represent the external associations between subcommunities. (b) Comparison of node-level topological features among four different subcommunities. The top and bottom boundaries of each box indicate the 75th and 25th quartile values, and lines within each box represent the median values. Different letters indicate significant differences (P < 0.05), determined by the nonparametric Mann-Whitney U test.

