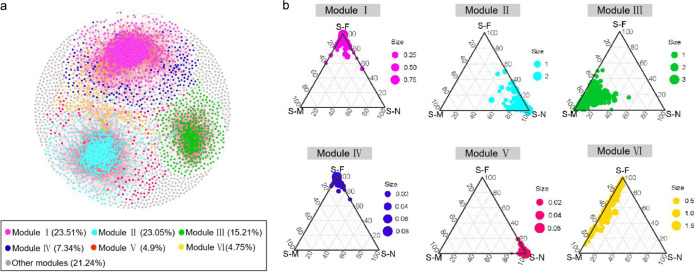
FIG 6.
Co-occurrence patterns of OTUs. The nodes were colored according to different types of modularity class (a). Ternary plots displaying the relative abundance of OTUs from modules I to VI in the three transects (b). A connection stands for a strong (Spearman’s ρ > 0.8 or ρ < −0.8) and significant (P < 0.01) correlation. The size of each node is proportional to the number of connections (i.e., degree). Major modules have more than 80 nodes. Other modules include small modules (n = 223) with ≤10 nodes per module. Each circle represents one individual OTU. For each OTU, abundance was averaged over all samples at each transect.

