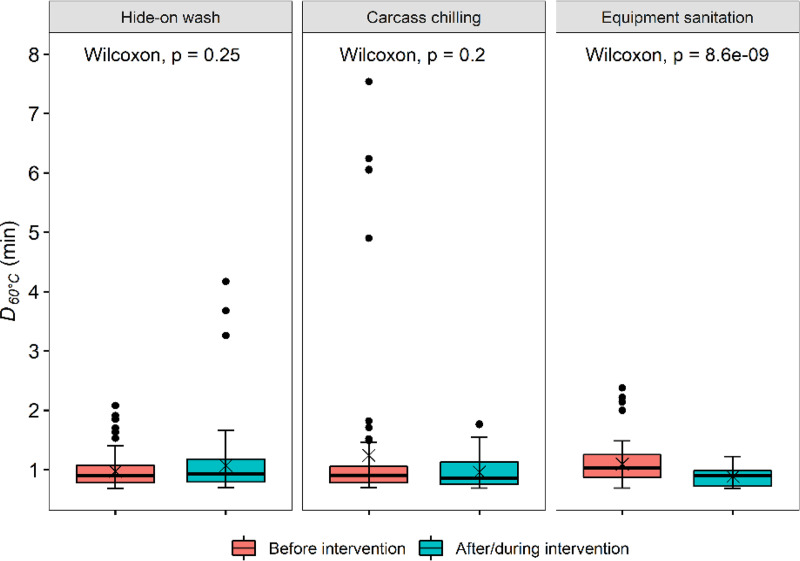
FIG 2.
D60°C values (min) for Escherichia coli isolates (n = 600) recovered from beef packing plants. From left to right are E. coli from carcasses before and after the hide-on wash intervention, E. coli from dressed carcasses before and during carcass chilling, and E. coli from fabrication equipment before and after the daily routine sanitation. Central horizontal lines and “x” marks indicate medians and means, respectively; whiskers indicate the lowest data point within 1.5 IQR of the first quartile and the highest data point within 1.5 IQR of the third quartile. Filled circles indicate data points below or above the 1.5 IQR of the first or third quartile, respectively. Each group included 100 E. coli isolates.

