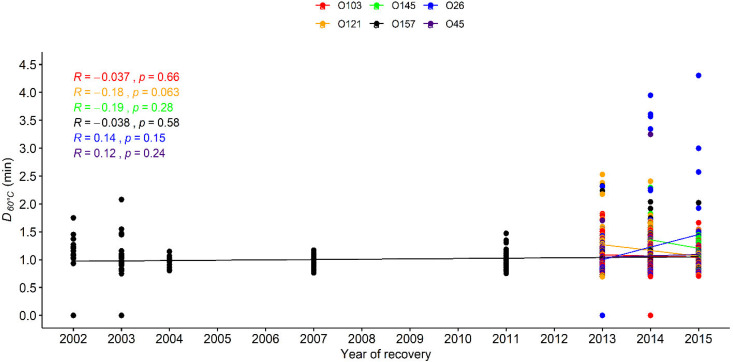
FIG 3.
D60°C values (min) for six Escherichia coli serogroups (O157, O26, O45, O103, O121, and O145) recovered from different years. The data points show the D60°C values for E. coli of the six serogroups, and each line shows the trend of the D value change for each group along the years of isolation. As the D value of each serogroup did not follow normal distribution, the correlation between heat resistance in each serogroup and recovery year was examined using Spearman’s method. The Spearman’s rank correlation coefficients (R) and P values are shown in the figure.

