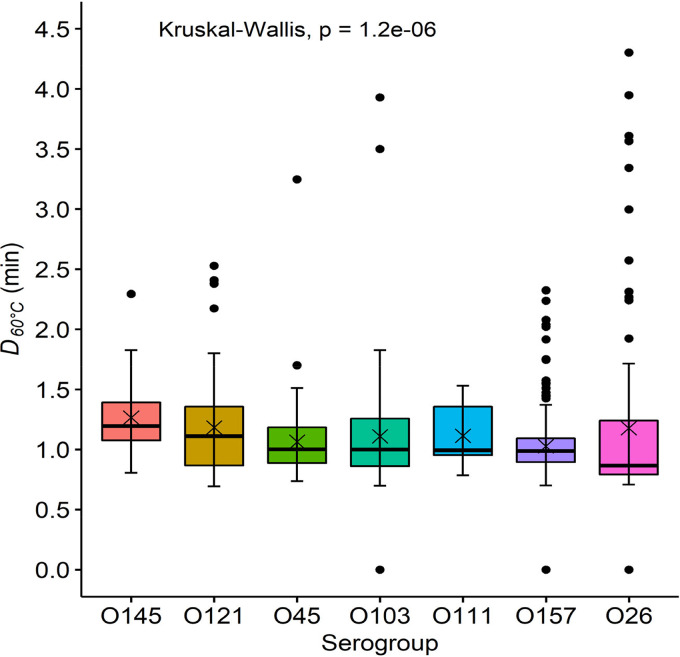
FIG 5.
D60°C values (min) for the Top 7 Escherichia coli isolates. Central horizontal lines and “x” marks indicate medians and means, respectively; whiskers indicate the lowest data point within 1.5 IQR of the first quartile and the highest data point within 1.5 IQR of the third quartile. Filled circles indicate data points below or above the 1.5 IQR of the first or third quartile, respectively. The Top 7 E. coli included serogroups O103 (n = 157), O111 (n = 12), O121 (n = 103), O145 (n = 35), O157 (n = 239), O26 (n = 100), and O45 (n = 104). The serogroups in the figure are ordered according to the level of the median D60°C value in each group.

