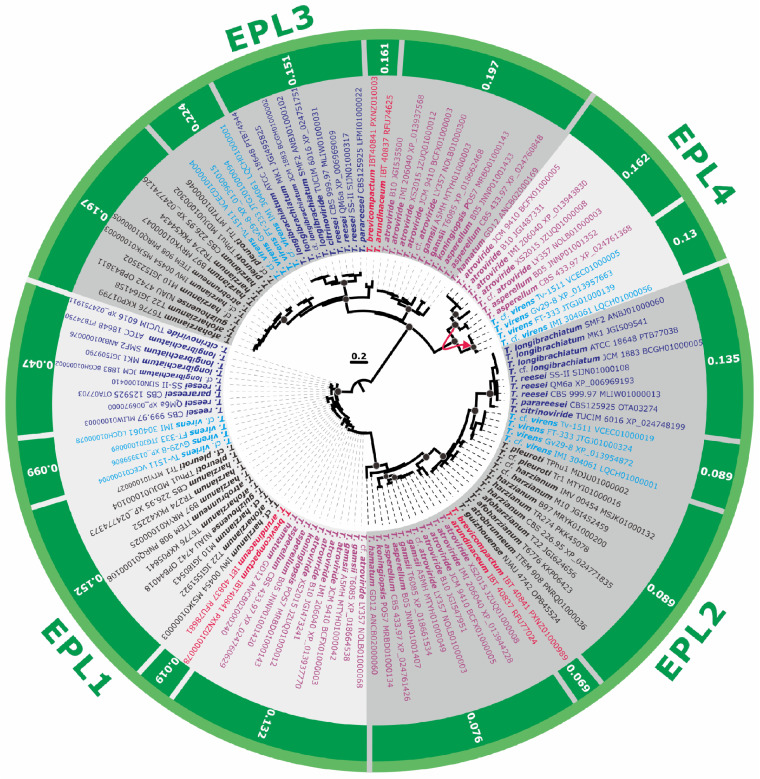
FIG 2.
Maximum-likelihood phylogram (proteins) and natural selection pressure analyses (genes) of CPs in 37 genomes of Trichoderma spp. The phylogram was constructed using IQ-TREE 1.6.12 (bootstrap replicate n = 1,000). Circles at the nodes indicate IQTree ultrafast bootstrap support values of >75. The outer numbers represent the ratios of nonsynonymous/synonymous substitution rates (ω = dN/dS) for the natural selection pressure for all branches tested as estimated using EasyCodeML. No other types of natural selection pressure were found for the tested genes from the Trichoderma genomes included (a ratio of 0 < ω < 1 indicates purifying natural selection). The red arrow shows the case of LGT (see Fig. 1 for details). Protein accession numbers are provided for every OTU. Colored fonts highlight the same infrageneric groups of Trichoderma (37, 57).

