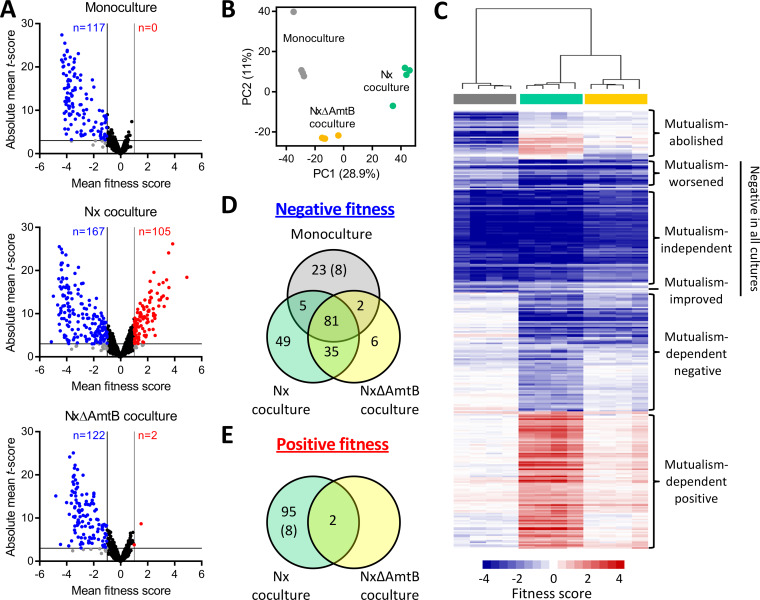
FIG 2.
Summary of RB-TnSeq results identifying E. coli fitness determinants in monoculture or coculture with R. palustris. (A) Volcano plots showing mean fitness scores and absolute mean t-scores for 3,564 E. coli gene mutants grown in monoculture (top), Nx coculture (middle), or NxΔAmtB coculture (bottom). Each circle represents a single gene, with fitness scores and t-scores averaged across culture replicates (n = 4). Vertical lines indicate a fitness score threshold of |fitness|>1. Horizontal lines indicate a t-score threshold of |t-score| > 3. Genes with strong negative or positive fitness scores are indicated in blue or red, respectively. Black circles indicate genes that did not meet the fitness score threshold; gray circles indicate genes that met the fitness score threshold but not the t-score threshold. (B) Two-component principal component (PC) analysis using fitness scores for 3,564 E. coli genes for individual monocultures (gray), Nx cocultures (teal), or NxΔAmtB cocultures (yellow). Percentages indicate variance captured by each of the first two PCs. (C) Heatmap showing fitness scores and designated effect categories for the 306 genes having strong fitness effects in at least one culture type. Genes and samples were clustered hierarchically (average linkage, uncentered correlation). Columns are fitness scores from independent replicates, with culture type indicated by the colored bars below the cluster tree (gray, monoculture; teal, Nx coculture; yellow, NxΔAmtB coculture). (D and E) Venn diagrams of genes having strong negative (D) or positive (E) fitness scores in the indicated culture types. Eight genes had negative fitness scores in monoculture but positive fitness scores in Nx coculture (indicated by parentheses).

