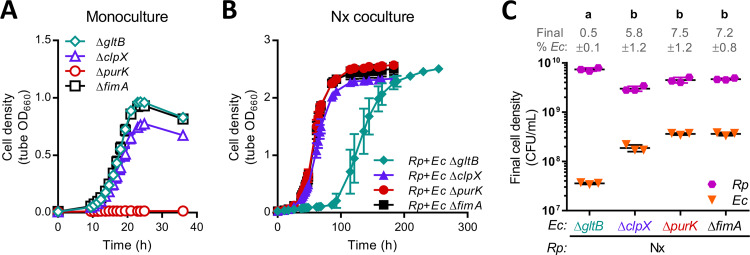
FIG 5.
Growth of select KEIO mutants in monoculture and Nx coculture. Growth of individual KEIO mutant monocultures (A) or cocultures pairing individual KEIO mutants with R. palustris Nx (B). The KEIO ΔfimA mutant was used as a control because it carries the same kanamycin resistance cassette as the other mutants and fimA had negligible fitness effects by RB-TnSeq (Table S2). The data are presented as means ± the standard deviations (n = 3). Some error bars are too small to visualize. OD measurements were taken within culture tubes (tube OD). (C) Final cell densities of individual E. coli KEIO mutants and R. palustris Nx after growth in coculture. CFU were measured at the final time points in the respective growth curves in panel B. Different letters indicate statistical differences between groups (P < 0.05, one-way analysis of variance with Tukey’s posttest, n = 3). Error bars indicate the standard deviations.

