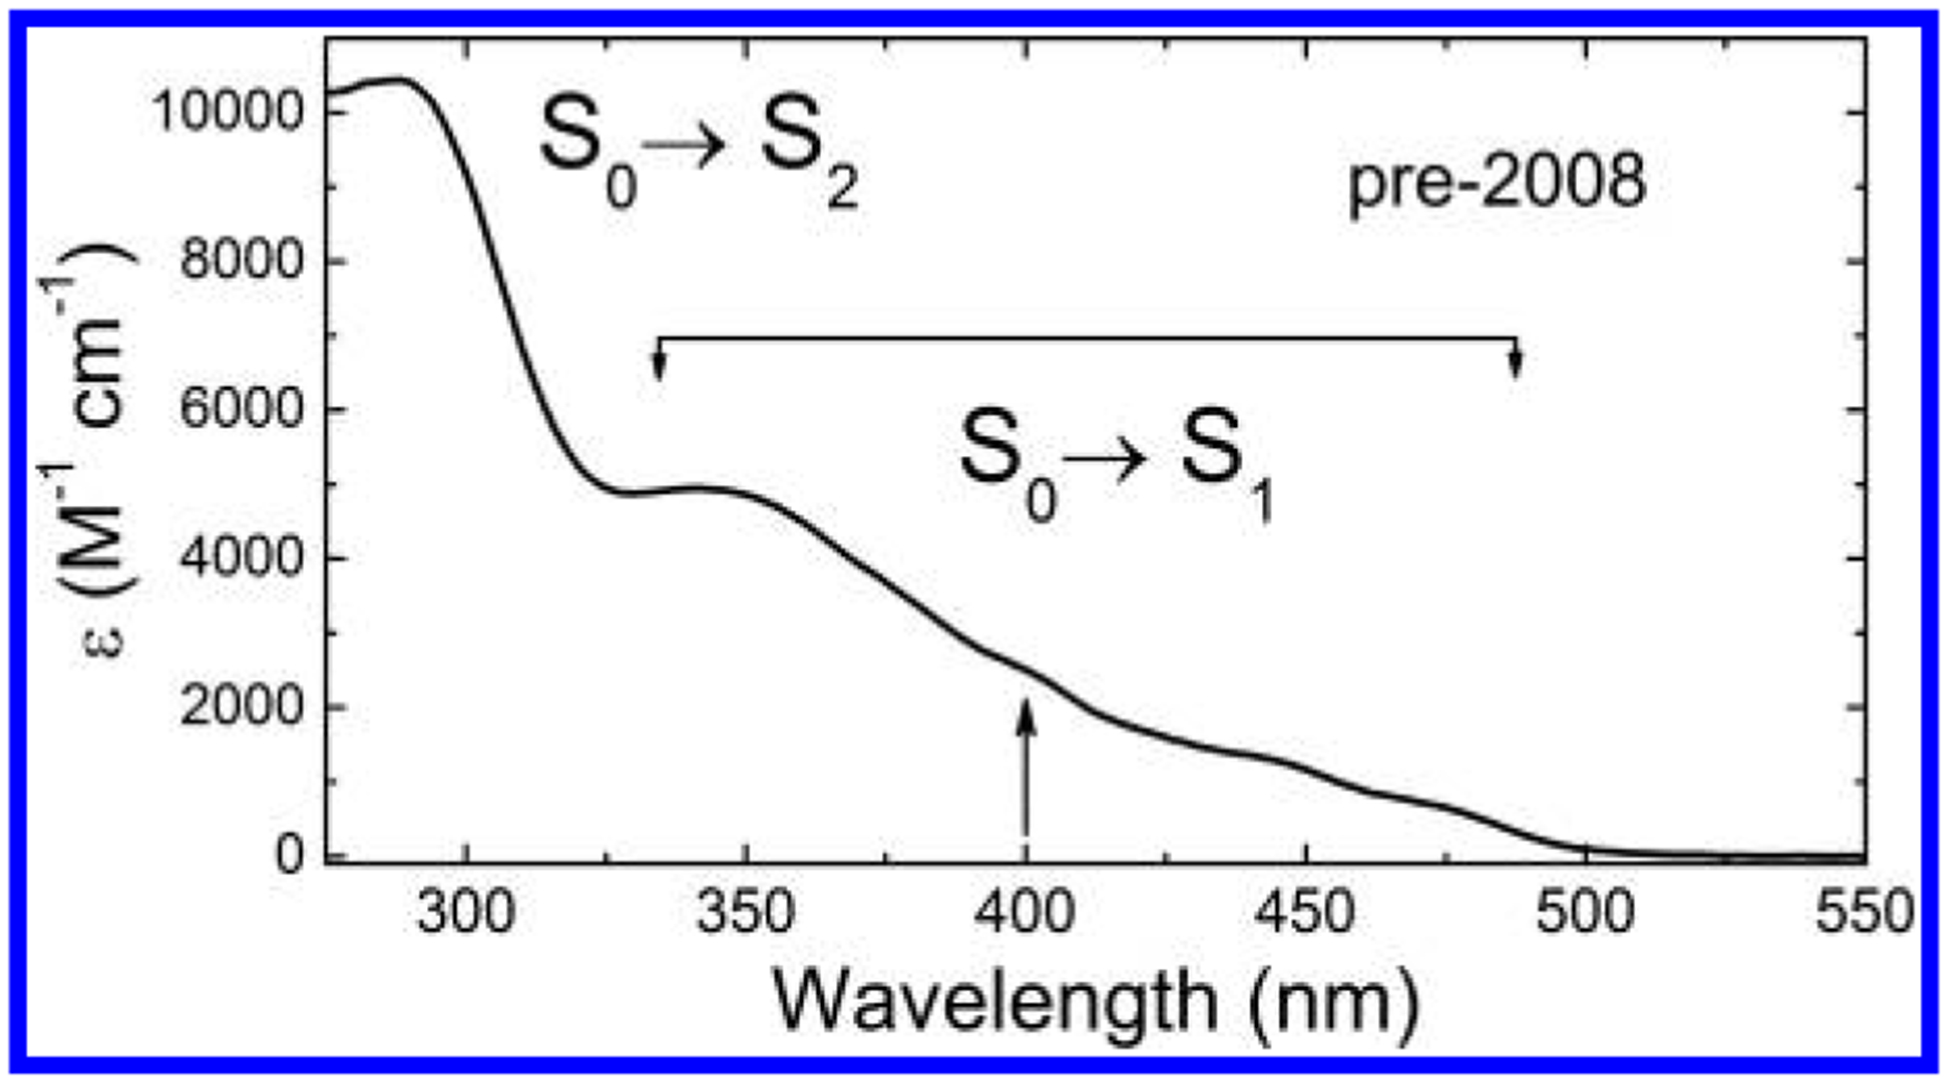
Figure 2.

298 K absorption spectrum of FlH− in EtOH. S0→Sn assignments reflect pre-2008 assumptions about putative vibronic structure of the S0→S1 band between 350 and 500 nm, with the assumed S0→S2 band maximum at about 290 nm. The arrow at 400 nm indicates a commonly used Ti:sapphire laser wavelength for flavin studies.
