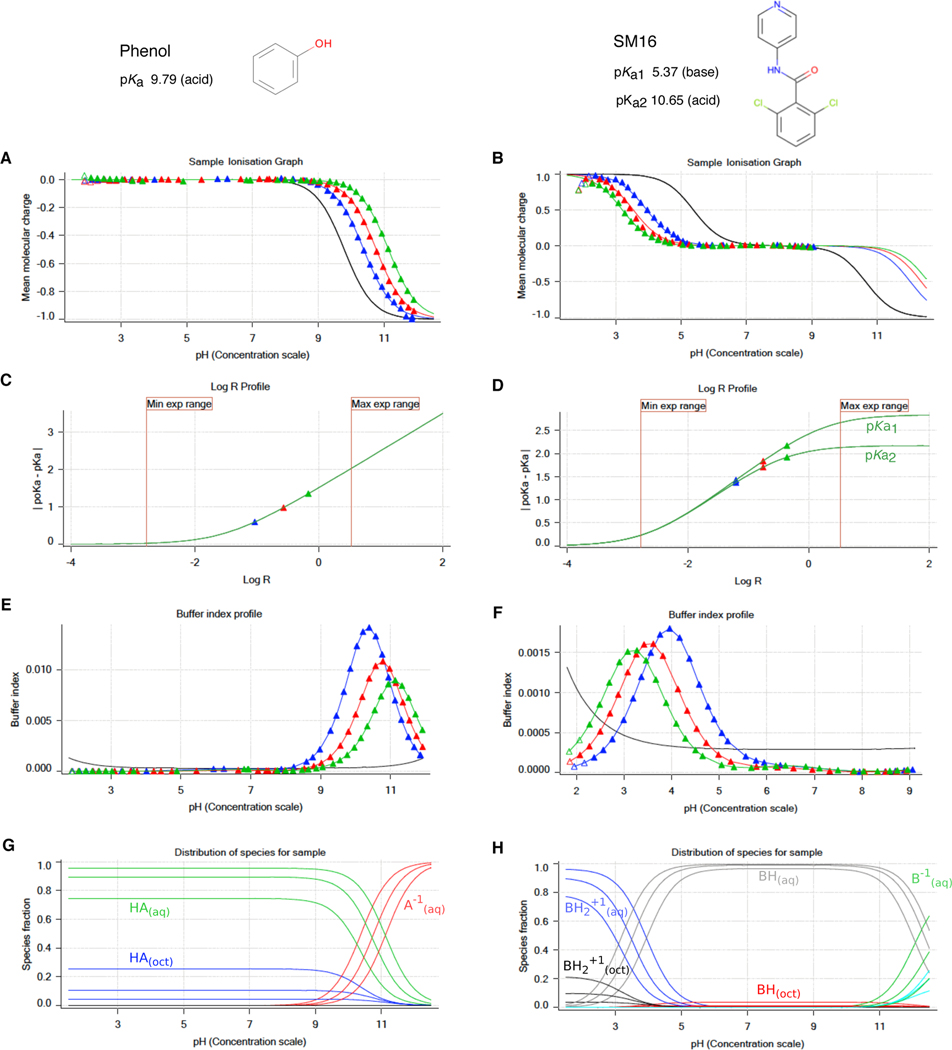
Figure 2. Illustrative potentiometric log P measurements of phenol (monoprotic, acid, log P 1.49) and SM16 (diprotic, amphoteric, log P 2.62) with the Sirius T3.
Triangles represent experimental data points collected during the octanol-ISA water titrations and solid lines represent the ionization and partitioning model fit to the data. A, B: Computed mean molecular charge vs pH. Mean molecular charge is calculated based on experimental pKa values and types (acid or base type) of the analyte. The black line is the model titration curve in aqueous media and based on the aqueous pKa. Blue, red, and green triangles represent three sequential titrations with increasing log R (increasing octanol) that show shifted poKa values. The inflection point of titration curves indicates the pKa or poKa, though these values are obtained by a global fit. For titration of acidic species, partitioning into the octanol phase increases the observed poKa. In the titration of the basic pKa of SM16, increasing log R causes a decrease in poKa. The pH range of the experiment was determined such that only the titration of basic pKa was captured (molecular charge between +1 and 0). C, D: log R profiles show a shift in poKa with respect to increasing relative octanol volume. These plots aid in the design of the experiment and selection of optimal octanol volumes that aim to maximize separation between poKa values for better model fit within experimental limitations (pH and analysis vial volume). E, F: Buffer index profiles show buffering capacity observed in three titrations with increasing log R (blue to green). The black line is the intrinsic buffering capacity of water. For an accurate potentiometric measurement, buffering capacity signal of the analyte must be above the buffering capacity of water. As octanol volume increases, the concentration of the analyte in aqueous phase, and thus buffering capacity, decreases. G, H: Predicted relative populations of ionization states in octanol and water phases as a function of pH, based on the equilibrium model fit to experimental data.

