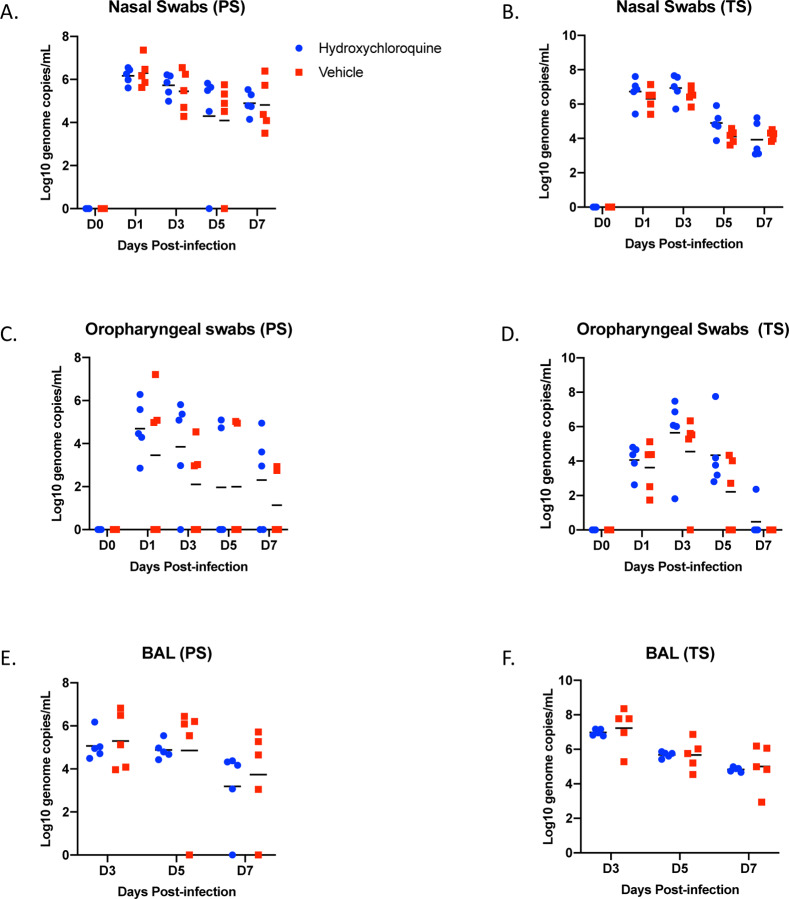
Figure 3: Rhesus macaque model – viral loads in lower and upper respiratory tract.
Macaques were infected with SARS-CoV-2 as described in the legend of Figure 2. Swab samples (nasal and oropharyngeal) and bronchioalveolar lavage (BAL) were collected at all or indicated examination time points. Viral loads were determined by qRT-PCR as genome copies. (A and B) Nasal swabs. (C and D) Oropharyngeal swabs. (E and F) Bronchioalveolar lavage (BAL). No statistical significance was found among the groups presented in (A) to (F). Multiple t tests were used to analyze data and no significant difference was found. Note: red squares, vehicle-treated animals; blue circles, HCQ-treated animals; PS, prophylaxis; TS, treatment.

