
Figure 2.
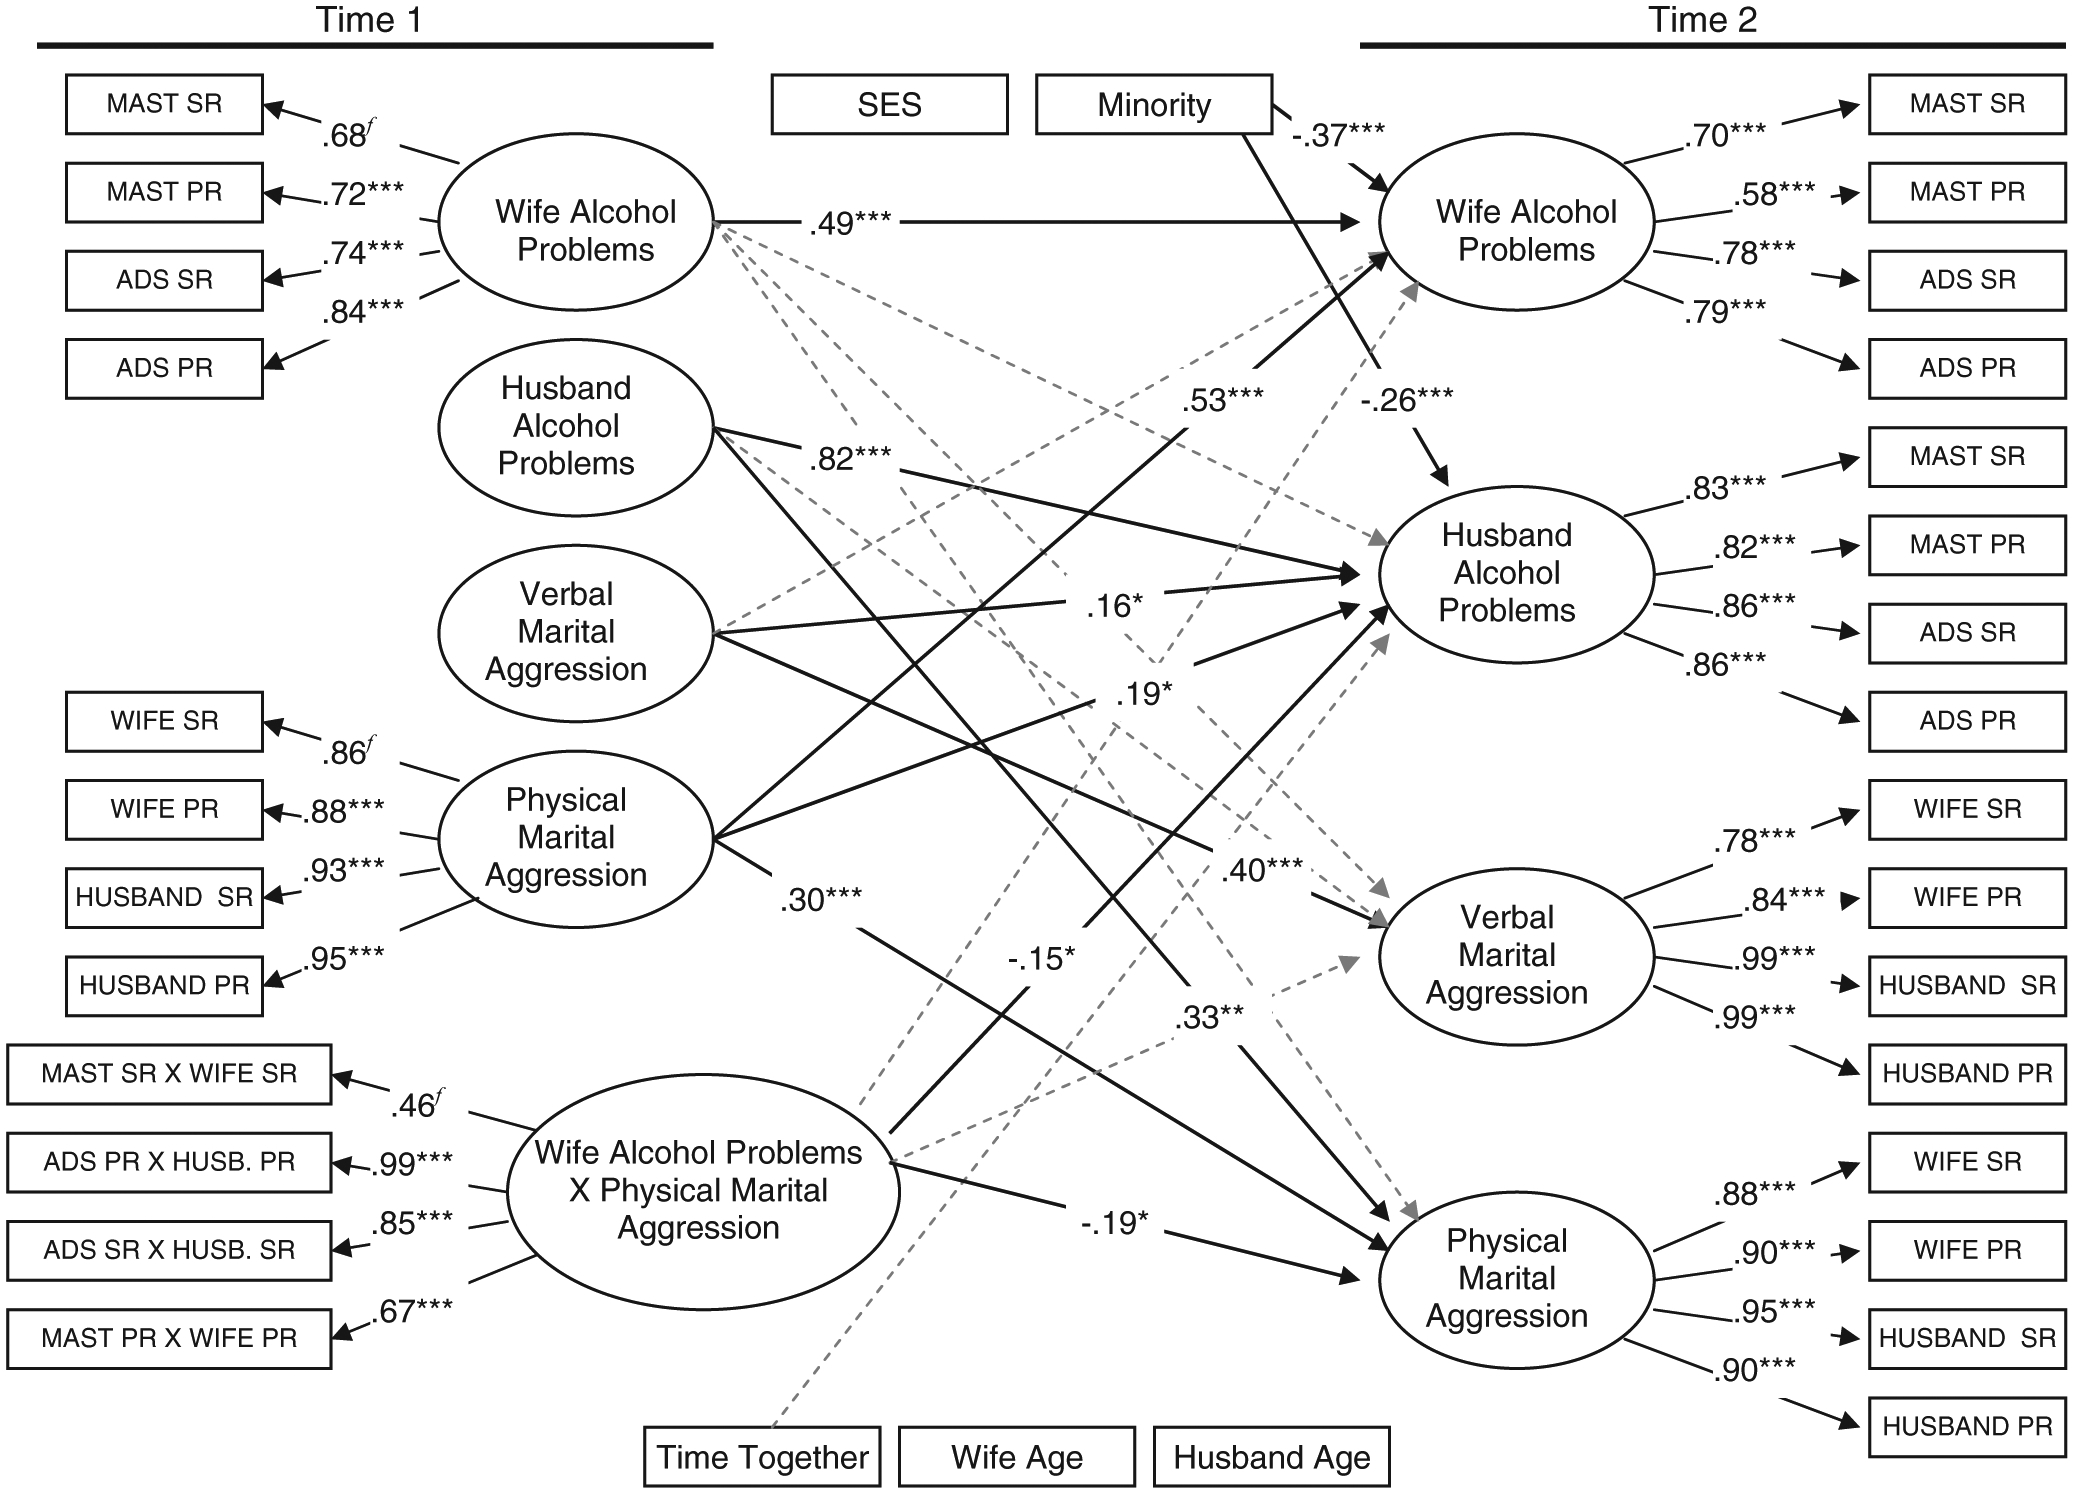
Interaction between wife alcohol problems and physical marital aggression. Path coefficients are standardized. Significant pathways are presented as solid lines while non-significant pathways are presented as dotted lines. Latent variables within the same time point were allowed to correlate, as were error variance across time and within report. These correlations are not shown to improve the clarity of presentation. f denotes a fixed path, * p < .05, ** p < .01, *** p < .001. SR = Self-report, PR = Partner-report; MAST = Michigan Alcoholism Screening Test; ADS = Alcohol Dependence Scale. χ2(642) = 1060.9, p < .001, χ2/df = 1.652, CFI = .905, NFI = .799, TLI = .873, and RMSEA = .064.