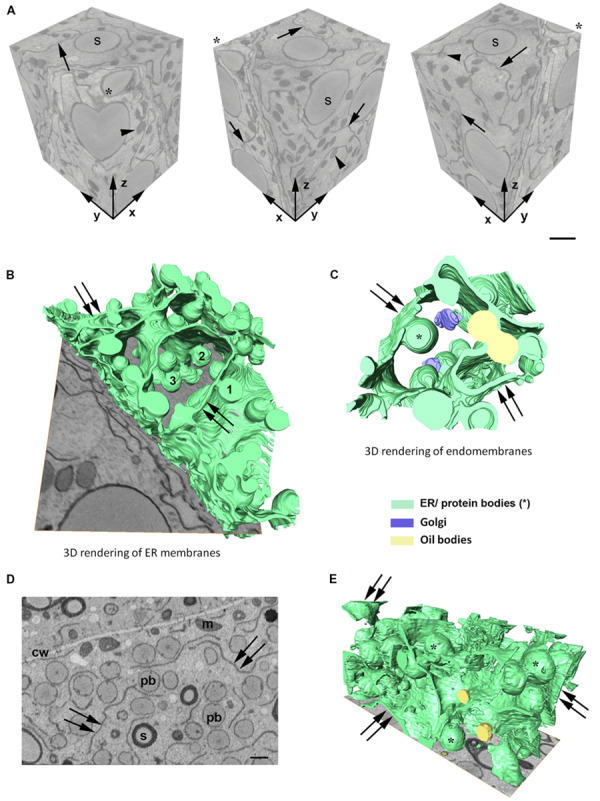
FIGURE 2.

(A) Serial block face imaging of a starchy endosperm cell at mid-developmental stage (14 dap, Stage 2) and cut at 40-nm increments. Reconstructed volume, shown from different angles (asterisk marks the same corner at different positions). Note the high resolution in the z axis. Arrows mark the ER and arrowheads the protein bodies. Number of slices: 350, total volume: 2646 μm3, pixel size 20 × 20 nm. Scale bar, 1 μm. (B–E) 3D rendering of membranes in endosperm cells at different developmental stages. (B,C) Developmental stage 2 (14 dap). (D,E) Developmental stage 3 (21 dap). 3D rendering of ER membranes (B) and endomembranes (C) in a starchy endosperm cell. Massive ER sheets (double arrows) and abundant protein bodies (1, 2, 3) are budding from different z-positions (B). Oil bodies bud from ER sheets (double arrows) neighboring the domains where PBs are formed (C). (D) Representative z-stack image showing shorter ER strands (double arrow) and abundant protein bodies (>1 μm, pb). Cell wall (cw), mitochondria (m), starch (s). Scale bar, 1 μm. (E) 3D rendering of membranes. Smaller ER sheets (double arrow), protein bodies (∗).
