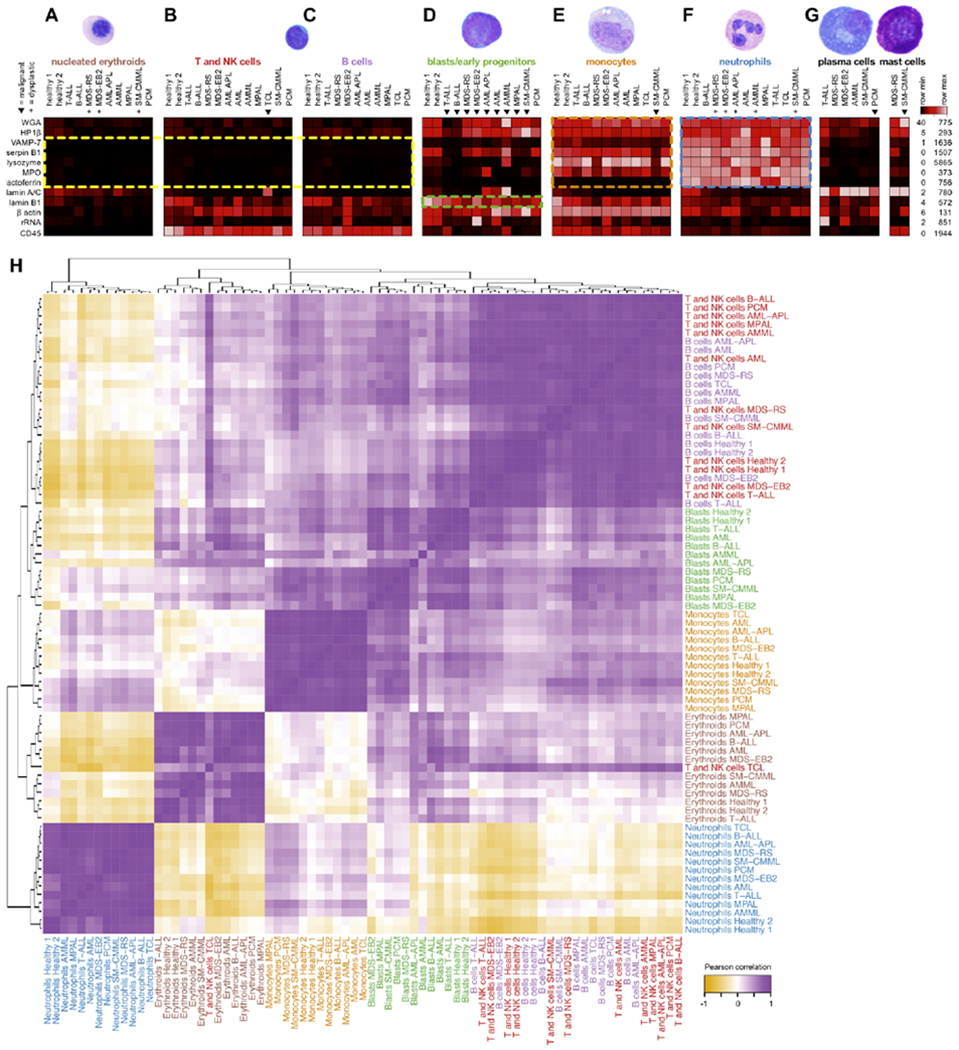
Figure 2: Morphometric profiles are consistent across clinical patient samples.

Scatterbody profiles of major populations (A-G, labels colored as in Fig. 1c) from the 11 main clinical samples and two healthy marrow donors. Clinical samples contain mixtures of normal and neoplastic populations, where triangles (▼) denote malignant populations as diagnosed by WHO criteria,5 and plus symbols (+) denote morphologically dysplastic (malformed) populations as determined by light microscopy. Not all samples contained significant numbers of all populations, and populations with fewer than 20 events (cells) are not shown. Each column represents the median values of scatterbodies of a single population from a single sample, scaled by row. Lamin A/C and lysozyme were scaled to a maximum of 500 counts due to plasma cell lamin A/C obscuring other populations and a lysozyme outlier >6-fold greater than all other populations. H) Pearson correlation of scatterbody profiles for hand-gated cell populations across all eleven representative samples and two healthy controls. Each scatterbody profile is defined as the vector of median expression values for all scatterbodies. The heatmap was hierarchically clustered and labels were colored by hematopoietic cell population.
