Abstract
NOx lifetime relates nonlinearly to its own concentration; therefore, by observing how NOx lifetime changes with changes in its concentration, inferences can be made about the dominant chemistry occurring in an urban plume. We used satellite observations of NO2 from a new high-resolution product to show that NOx lifetime in approximately 30 North American cities has changed between 2005 and 2014 in a manner consistent with our understanding of NOx chemistry.
Nitrogen oxides (NOx = NO + NO2) play a critical role in air quality, affecting human and plant health both directly (1, 2) and indirectly through the formation of surface-level ozone (3) and particulate matter (4–6) as well as by influencing the radiative balance of the atmosphere (7). Combustion in vehicle engines or industrial processes is the main cause of anthropogenic NOx emissions; consequently, most developed nations have taken steps to reduce anthropogenic emissions through new regulations and technology.
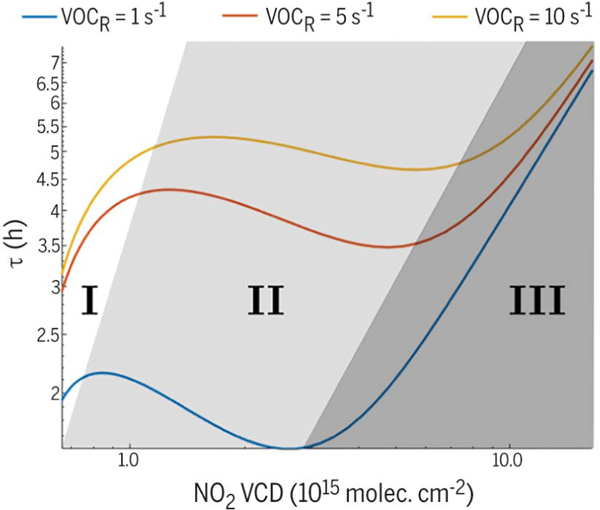
However, NOx lifetime is nonlinearly dependent on NOx concentration (8, 9); therefore, changes in atmospheric concentrations of NOx because of emissions reductions will depend not only on the magnitude of the reduction but also on the chemical regime active within a given air mass. Theoretical calculations of NOx lifetime versus concentration are shown for three different volatile organic compound reactivities (VOCR) in Fig. 1. In the “NOx-limited” regime (Fig. 1, region II), NOx lifetime decreases with increasing concentration of NOx, whereas in the “NOx-suppressed” regime (Fig. 1, region III), the opposite relationship is observed.
Fig. 1. Theoretical NOx lifetime calculated assuming steady state for the HOx family.
P(HOx) = 0.3 parts per trillion (ppt) s−1, and the alkyl nitrate branching ratio α = 0.04.
NO2 VCDs were calculated from NOx concentrations assuming a 1-km planetary boundary layer, a 4:1 NO2:NO ratio, and a 5 × 10¹⁴ molecules cm−2 free tropospheric background NO2 column. The Roman numerals and background shading identify regions used in the main text. VOCR is volatile organic compound (VOC) reactivity, a measure of how quickly VOCs react with OH.
Satellite observations of NO2 have been used to directly infer a plume-average NOx lifetime in urban and power plant plumes by calculating the e-folding distance for an NO2 plume downwind of a source and converting this distance to a lifetime with the average plume wind speed (8,10,11). This approach has been used previously to show that the OH concentration in an urban plume varies with wind speed (8) and to examine spatial patterns in NOx lifetime across the United States (11).
We used version 3.0B of the Berkeley High Resolution (BEHR) NO2 product (12,13) to directly observe NOx lifetime in ~30 North American cities. The BEHR product, with high-resolution daily NO2 a priori profiles, was necessary to this study because previous work (14) has shown that daily, high-resolution profiles are necessary to simultaneously retrieve NO2 vertical column densities (VCDs) and lifetimes to accuracies of 30% or better. We show that there are observable changes in North American urban NOx lifetime and that these changes suggest a transition from the NOx-suppressed to NOx-limited regime. We examined the implications for ozone production and the relationship between trends in NOx emissions and NO2 VCDs.
To calculate the effective lifetime in each city’s NOx plume, we computed line densities along the downwind direction averaged over April through September in 3-year periods. Throughout this work, we refer to these periods by the middle year; for example, “2006” represents results from April to September in 2005,2006, and 2007. We focused on weekday (defined as Tuesday through Friday) lifetimes because the greater weekday NOx emissions owing to heavy truck traffic (15, 16) mean weekday lifetime will have a greater effect on NOx concentration and therefore air quality. Details of this method, including quality filtering, are provided in the supplementary materials (17). This method has been used successfully in numerous prior studies (8,10,11,18,19).
Of the 49 cities initially chosen, 12 had no valid fits during the study period. Three of the remaining 37 had no statistically significant change in NOx weekday lifetime over the 2005–2014 time period studied (Houston, Texas; Salt Lake City, Utah; and Seattle, Washington). The remaining 34 cities were categorized by the shape of their lifetime trend over time: increasing, decreasing, concave up (CCU), or concave down (CCD). Of these 34, three cities (Chicago, Illinois; Detroit, Michigan; and Richmond, Virginia) had significant changes in lifetime but did not fit cleanly into these categories, and three were not included because they had only two good quality fits (Columbus, Ohio, increasing; Jacksonville, Florida, decreasing; and Tucson, Arizona, increasing).
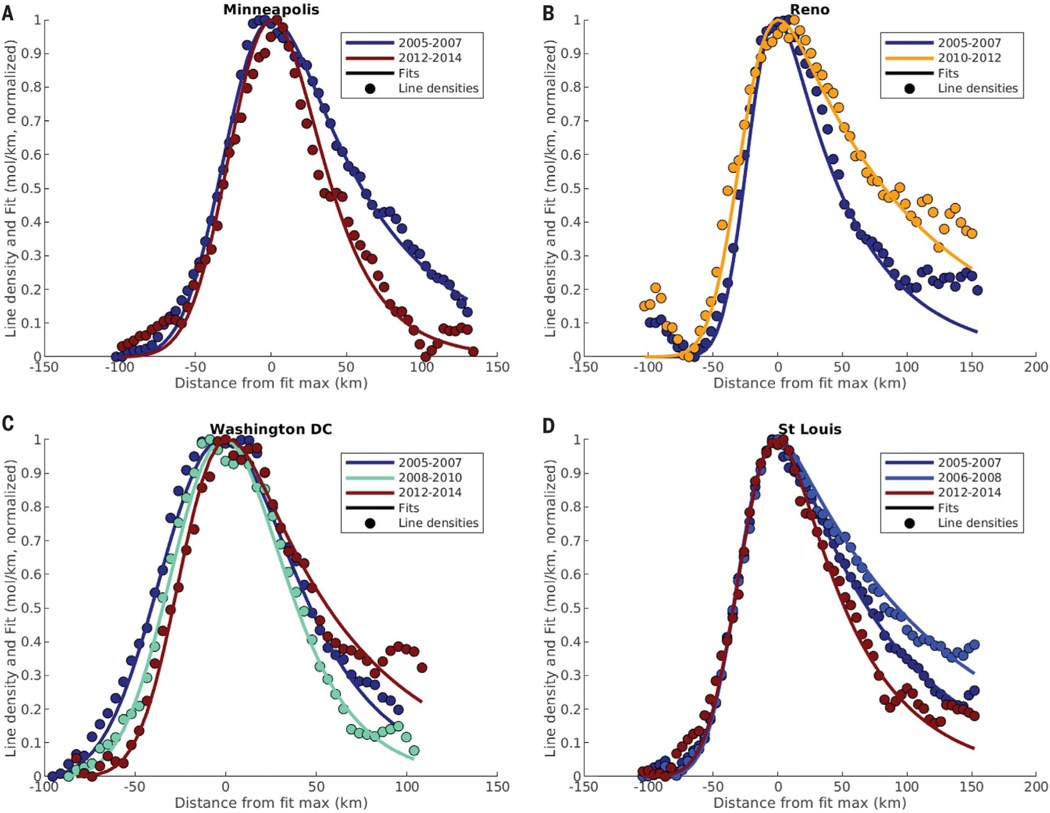
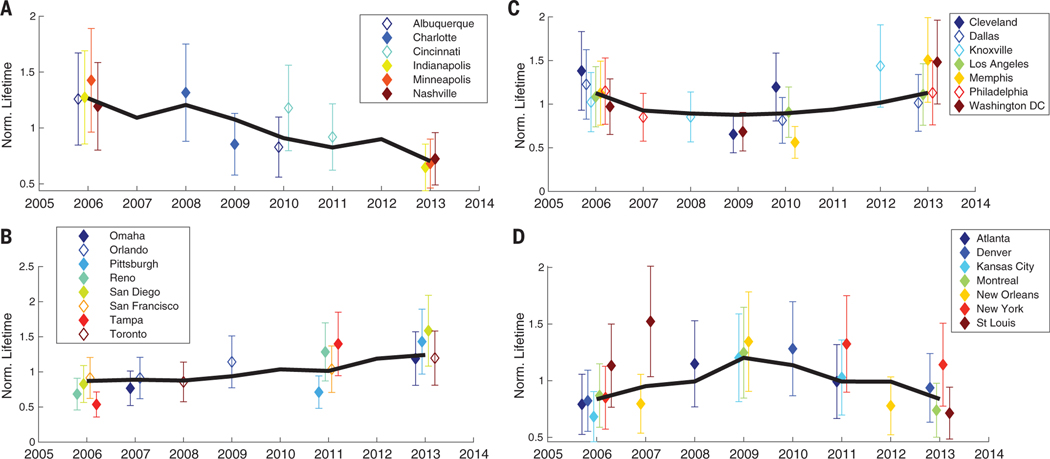
Line densities and fits from specific 3-year periods that describe the shape of the trend are shown for one city from each group in Fig. 2. There are clear changes in the rate of decay of the line densities downwind of the city. The trends of all cities in these four groups are shown in Fig. 3. The lifetimes shown are normalized to each city’s mean lifetime. In addition to the median normalized lifetime for each group (Fig. 3, black line), normalized lifetimes in key years for individual cities are shown in Fig. 3 as the diamonds. The individual years are such that each point for a given city is statistically different from the ones preceding and following it. Unnormalized lifetimes are presented in fig. S1.
Fig. 2. Line densities and fits for four example cities, one from each group.
(A) Decreasing. (B) Increasing. (C) CCU. (D) CCD. Line densities are shown as circles, and fits are shown as solid lines. y axis values are normalized to a range of 0 to 1, and x axis values are positioned so that the maximum value of the fit occurs at 0.
Fig. 3. Weekday (Tuesday through Friday) NOx lifetime, normalized to each city’s mean, for North American cities, divided into four groups based on the overall trend during the 2005–2014 time period.
(A) Decreasing. (B) Increasing. (C) CCU. (D) CCD. In (A) to (D), the black line indicates the median lifetime of the group, and the diamonds with error bars indicate individual lifetimes and their uncertainties for a city in a given 3-year period. Uncertainties are the absolute uncertainty in lifetimes. Open diamonds indicate cities that have statistically different fits, but the line densities have noticeable overlap between years.
Although the uncertainties of the absolute lifetimes are quite large (~30%), much of the error is likely correlated in between years (supplementary text), leading to smaller relative uncertainty in the trends. However, the fraction of the error that is correlated is not well characterized. To be conservative, we retained the absolute uncertainty when considering the trends. The trends shown in Fig. 3 are statistically significant as determined with pairwise t tests, using the ~30% absolute error. Additionally, for approximately two-thirds of cities included, the difference in downwind decay was sufficiently large to identify visually in the line densities (figs. S7 to S11).
In theory, total NOx lifetime is controlled by two processes: loss to nitric acid and loss to alkyl nitrates. These processes are in competition, with nitric acid dominating at high NOx concentrations and alkyl nitrates dominating at lowNOx concentrations. The exact crossover point depends on the VOCR, HOx production [P(HOx)], and alkyl nitrate branching ratio (α).
A theoretical calculation of the dependence of NOx lifetime on NOx concentration and VOCR for fixed P(HOx) and a is shown in Fig. 1. The theoretical behavior can be divided into three regions, identified in Fig. 1 by the background shading and Roman numerals. Region III, traditionally termed the “NOx suppressed” or “VOC limited” regime, is characterized by decreasing NOx lifetime with decreasing NOx concentration. Loss of NOx to nitric acid is the primary loss route in this regime. Region II, part of the “NOx limited” regime, is characterized by increasing NOx lifetime with decreasing NOx concentration. Region I, also part of the NOx limited regime at very low NOx concentrations, once again has decreasing NOx lifetime with decreasing NOx concentration.
The turning points that define the regions occur because of shifts in the dominant chemical loss pathways. The minimum between regions II and III is the point at which the sum of losses to alkyl nitrates and nitric acid is at its maximum. Below this, loss to nitric acid slows. The maximum between regions I and II occurs because the model predicts an increase in RO2 radicals below that NOx concentration, causing the loss of NOx to alkyl nitrates to accelerate.
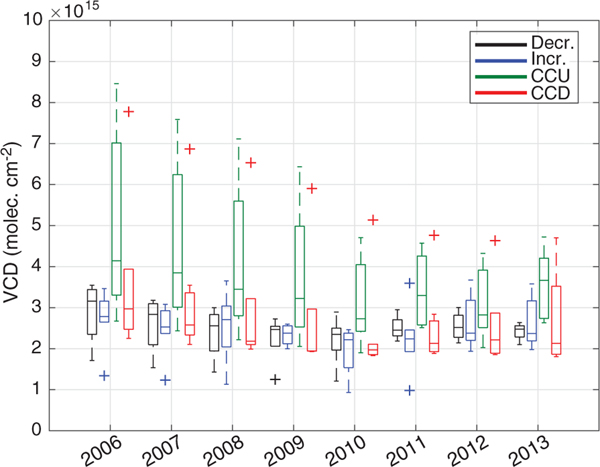
If we assume that the changes in lifetime are driven entirely by changes in NOx concentration, then it is straightforward to identify where on the lifetime curves in Fig. 1 each of the groups shown in Fig. 3 lie. Cities that exhibit a minimum or maximum in NOx lifetime (Fig. 3, C and D, respectively) are straight-forward to locate on Fig. 1. The CCU shape of the lifetime trends for cities in Fig. 3C can be explained if these cities started in region III and crossed into region II after going through their minimum lifetime. Likewise, the CCD lifetime trends of cities in Fig. 3D can be explained if these cities began in region II and transitioned into region I. Cities with consistently increasing lifetimes (Fig. 3B) must lie entirely in region II because that is the only region with . Cities with decreasing lifetime with time could fall in either region I or III; however, they must fall entirely in one region or another because they never show a significant positive slope of lifetime. The NO2 columns for this group are consistently less than those of the CCU group (Fig. 4), suggesting that the decreasing lifetime group is further left in Fig. 1 than the CCU group. Because the CCU group has entered region II by ~2010, this suggests that the decreasing group must be in region I.
Fig. 4. Distributions of NO2 columns for each of the four lifetime groups across the study time period.
For each box, the middle line indicates the median; the box top and bottom indicate the upper and lower quartiles, respectively; the whiskers indicate the farthest nonoutlier values; and plus (+) symbols indicate outliers.
This simple interpretation, which assumes the dominant factor in changing lifetime is changing NOx concentrations, is complicated by the fact that after 2010, there is no longer a monotonic decrease in NO2 columns (Fig. 4) (20). This suggests that either the changes in NOx concentrations controlling lifetime are not represented in the average columns presented in Fig. 4 or that factors other than NOx concentration control lifetime after 2010. As we will show, changing lifetime affects the proportionality between emissions and NO2 columns; because the columns in Fig. 4 represent an average over circles with 50- to 100-km radii, an increase in the NOx remaining downwind of the emission source owing to increasing lifetime could balance the decrease nearer the source, causing a net zero change in the average. If we consider other factors that might control lifetime, after 2010 when all cities are expected to be in regions I or II, our steady-state model predicts that a change of 1 to 2 s−1 in VOCR would lead to a ~50% change in lifetime (fig. S6A).
Qualitatively, these trends in lifetime suggest that all North American cities have entered a NOx-limited chemical regime by 2013 (Fig. 1, regions I and II). This is a plume-average chemical regime; there may be variations in the instantaneous chemical regime through-out the plume. Nevertheless, this has implications for future plans to control ozone production. The NOx-limited regime is so named because NOx is the limiting reagent in ozone production (21). Therefore, we predict that future controls on NOx emissions, rather than VOC emissions, will be more effective in limiting plume-average ozone production for North American cities.
Our observations of changing NOx lifetimes in North America also have implications for emissions constraints. One study (20) identified a discrepancy between the U.S. bottom-up NOx emission inventory and trends in NO2 VCDs over the United States. They found that after circa 2010, NO2 VCDs stopped decreasing, whereas the bottom-up inventory shows a steady decrease in NOx emissions. However, this assumes that the proportionality between emissions and NO2 columns is fixed over the study period. Under steady-state conditions, the column density expected is related to the product of lifetime and emissions by
| (1) |
where E is the emissions, k is the loss rate constant, t is the lifetime, and [NOx] is the NOx concentration. Above, we have shown that this is not true because variations in lifetime throughout the study period are of similar magnitude to that of the change in emissions being constrained (~30 to 50%). Crucially, we observed changes in lifetime after 2010, even though the precise cause of those changes is uncertain.
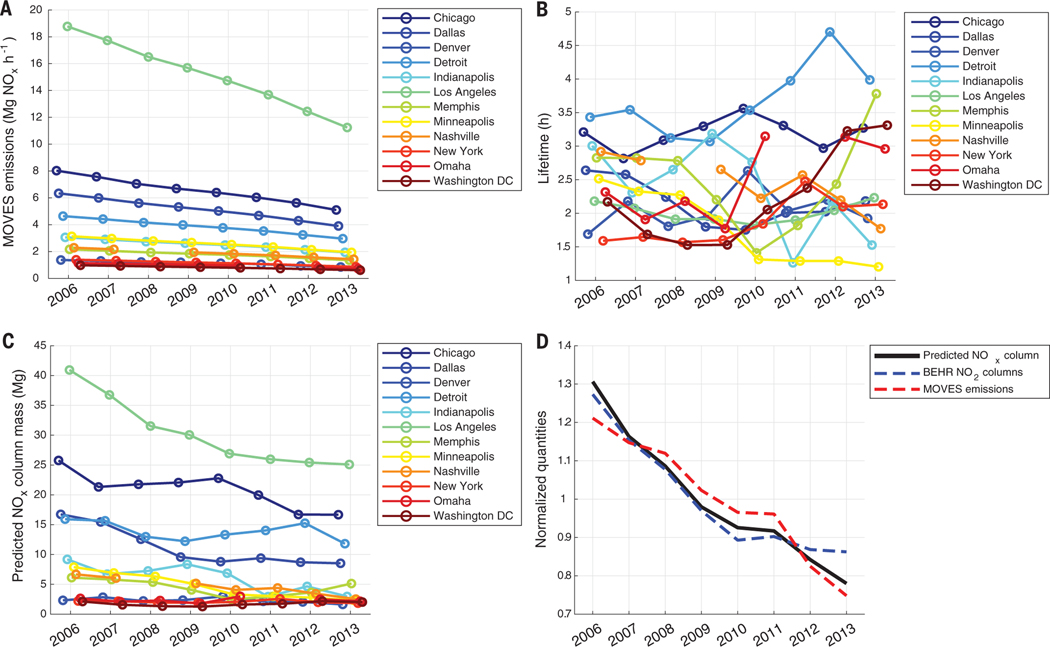
To demonstrate the effect of changing life-time, we used 12 cities that have at most one rejected weekday lifetime fit. This allowed us to have a nearly continuous record of their lifetime. We computed the mass of NOx expected over each city as the product of the city’s lifetime (Fig. 5B) and the NOx emissions from the U.S. Environmental Protection Agency’s Motor Vehicle Emission Simulator (MOVES) (Fig. 5A) for the county that contains the geographic center of the city. The result is shown in Fig. 5C. Nearly all of the top emitters show a flattening in predicted NOx trends after 2010, with Chicago as the most notable exception.
Fig. 5. NOx emissions, lifetime, and predicted column mass for 12 United States cities.
(A) MOVES NOx emissions for the core county of each of the 12 cities shown. (B) Lifetimes for the same 12 cities fit from BEHR line densities. (C) NOx mass predicted for 12 cities as the product of their lifetime and MOVES NOx emissions. (D) Trends in average NO2 VCDs and MOVES NOx emissions compared with the average predicted NOx mass for the 12 cities in (C). Each series in (D) is normalized to its average.
In Fig. 5D, we compare the predicted columns from Fig. 5C with observed BEHR NO2 columns. Accounting for the lifetime effect on the predicted columns better captures the rapid pre-2010 decrease in NO2 columns seen by BEHR and improves, though does not fully capture, the immediate post-2010 flattening in the column trends. By 2012–2013, discrepancies between the observed and predicted columns become more substantial; this suggests that at this point, other factors—such as the increasing contribution of background NO2 to urban plumes (fig. S3) (22)—play a dominant role in explaining the discrepancy between top-down and bottom-up emissions estimates. However, the better agreement between the predicted and observed column trends than the MOVES emissions and observed column trends demonstrates that changing NOx lifetime cannot be ignored in top-down emissions estimates.
We saw significant changes in NOx lifetime in North American cities that are of the same order as changes in NOx emissions over the same time periods. The pattern of these changes suggests that NOx-limited chemistry dominates North American urban plumes and also demonstrates that the change in NOx lifetime must be accounted for when relating NOx emissions and concentrations. Fully understanding the factors driving NOx lifetime after 2010 will require new techniques. Given the importance of changing NOx lifetime shown here, we hope that this work will spur other groups to pursue independent corroboration of these changes in lifetime through various methods, including high-resolution modeling efforts, meta-analyses of aircraft and ground-based data, and new, higher-resolution satellite products. The higher spatial resolution of TROPOMI (Tropospheric Monitoring Instrument) and upcoming geostationary satellites will provide more information on whether NOx concentrations near sources are continuing to decrease and therefore driving NOx lifetime changes, even though the average NO2 columns are unchanging after 2010. High-resolution HCHO retrievals will improve our ability to track urban VOC chemistry from space and therefore infer changes in VOCR relative to changes in NOx.
This work also suggests that space-based observations of NOx lifetime could provide valuable information about how the oxidative capacity of the atmosphere in North American cities changes over time. Previous work (8) used NOx lifetime measured from space to infer plume-average OH concentrations; how-ever, that work focused on the megacity Riyadh, where loss of NOx to nitric acid is the only meaningful loss pathway. By contrast, our work suggests that U.S. cities do have important alkyl nitrate chemistry. New methods will need to be developed to correctly account for the partitioning of loss NOx between alkyl nitrates and nitric acid in order to take full advantage of this capability.
Supplementary Material
ACKNOWLEDGMENTS
The authors thank P. Romer for assistance with the steady-state model used to generate Fig. 1.
Funding: This work was supported by a NASA ESS Fellowship (NNX14AK89H), NASA grant NNX15AE37G, and the TEMPO project (SV3–83019). This work used the Cheyenne high-performance computing cluster (doi:10.5065/D6RX99HX) provided by NCAR’s Computational and Information Systems Laboratory, sponsored by the National Science Foundation. This research also used the Savio computational cluster resource provided by the Berkeley Research Computing program at the University of California, Berkeley (supported by the University of California, Berkeley, chancellor, vice chancellor for research, and chief information officer).
Footnotes
REFERENCES AND NOTES
- 1.Wegmann M et al. , Exp. Toxicol. Pathol. 56, 341–350 (2005). [DOI] [PubMed] [Google Scholar]
- 2.Kampa M, Castanas E, Environ. Pollut. 151, 362–367 (2008). [DOI] [PubMed] [Google Scholar]
- 3.Haagen-Smit AJ et al. , Plant Physiol. 27, 18–34 (1952). [DOI] [PMC free article] [PubMed] [Google Scholar]
- 4.Pandis SN et al. , Atmos. Environ. A 26, 2269–2282 (1992). [Google Scholar]
- 5.C. A. Pope 3rd et al. , N. Engl. J. Med. 360, 376–386 (2009). [DOI] [PMC free article] [PubMed] [Google Scholar]
- 6.Burnett R et al. , Proc. Natl. Acad. Sci. U.S.A. 115, 9592–9597 (2018). [DOI] [PMC free article] [PubMed] [Google Scholar]
- 7.Myhre G et al. , Climate Change 2013: The Physical Science Basis. Contribution of Working Group I to the Fifth Assessment Report of the Intergovernmental Panel on Climate Change (Cambridge Univ. Press, 2013), pp. 659–740. [Google Scholar]
- 8.Valin LC et al. , Geophys. Res. Lett. 40, 1856–1860 (2013). [Google Scholar]
- 9.Browne EC et al. , Atmos. Chem. Phys. 14,1225–1238 (2014). [Google Scholar]
- 10.Beirle S et al. , Science 333, 1737–1739 (2011). [DOI] [PubMed] [Google Scholar]
- 11.Liu F et al. , Atmos. Chem. Phys. 16, 5283–5298 (2016). [Google Scholar]
- 12.Laughner JL et al. , Earth Syst. Sci. Data 10, 2069–2095 (2018). [Google Scholar]
- 13.Laughner J, Zhu Q, Cohen R, Berkeley High Resolution (BEHR) OMI NO2-Native pixels, daily profiles, v5, UC Berkeley Dash, Dataset (2018); doi: 10.6078/D1WH41. [DOI] [Google Scholar]
- 14.Laughner etal JL., Atmos. Chem. Phys. 16,15247–15264 (2016). [Google Scholar]
- 15.Murphy JG et al. , Atmos. Chem. Phys. 7, 5327–5339 (2007). [Google Scholar]
- 16.Marr LC, Harley RA, Environ. Sci. Technol. 36, 4099–4106 (2002). [DOI] [PubMed] [Google Scholar]
- 17. Materials and methods are available as supplementary materials.
- 18.Lu Z et al. , Atmos. Chem. Phys. 15, 10367–10383 (2015). [Google Scholar]
- 19.Liu F et al. , Atmos. Chem. Phys. 17, 9261–9275 (2017). [DOI] [PMC free article] [PubMed] [Google Scholar]
- 20.Jiang etal Z., Proc. Natl. Acad. Sci. U.S.A. 115, 5099–5104 (2018). [DOI] [PMC free article] [PubMed] [Google Scholar]
- 21.Pusede SE et al. , Chem. Rev. 115, 3898–3918 (2015). [DOI] [PubMed] [Google Scholar]
- 22.Silvern etal RF., Atmos. Chem. Phys. Discuss. 2019,1–26 (2019). [Google Scholar]
- 23.Laughner JL, behr-github/NAm-NOx-Lifetime: version 1.3 (2019); doi: 10.5281/zenodo.3386680. [DOI] [Google Scholar]
- 24.Laughner JL, Cohen RC, Supporting data for “Direct observation of changing NOx lifetime in North American cities”; doi: 10.6078/D1RQ4V. [DOI] [PMC free article] [PubMed] [Google Scholar]
Associated Data
This section collects any data citations, data availability statements, or supplementary materials included in this article.


