Fig. 4.
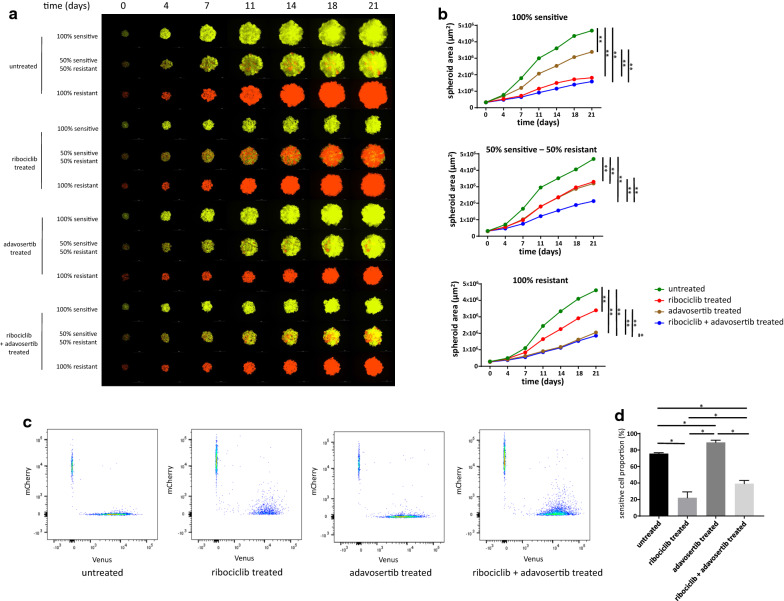
Effects of individual and combination treatments of ribociclib and adavosertib on spheroid growth and composition. a Representative images of time course spheroid growth of spheroids of different compositions. Images present the merged images of the Venus and mCherry channels. White bars correspond to 1000 µm. b Time course growth of spheroids presented on Panel A. Data points show average spheroid areas of three replicates, error bars show standard deviation if it is larger than the size of the data point. Vertical lines represent statistical comparisons of the spheroid area between spheroids on Day 21. Asterisks mark statistical significance (*p < 0.05, **p < 0.01). Further statistical analysis including all time points and raw data are presented in Additional file 1: Table S6. c Representative FACS analysis of mixed spheroids on Day 21 on untreated, ribociclib, adavosertib and ribociclib + adavosertib treated spheroids initiated in a composition of 50% sensitive and 50% resistant cells. Samples are identical to the mixed samples on Panel A (second, fifth, eighth and eleventh rows). d Proportion of sensitive cells under different treatments based on FACS analysis. Bars show the average of three replicates, error bars show standard deviation. Asterisks mark statistical significance (p < 0.05)

