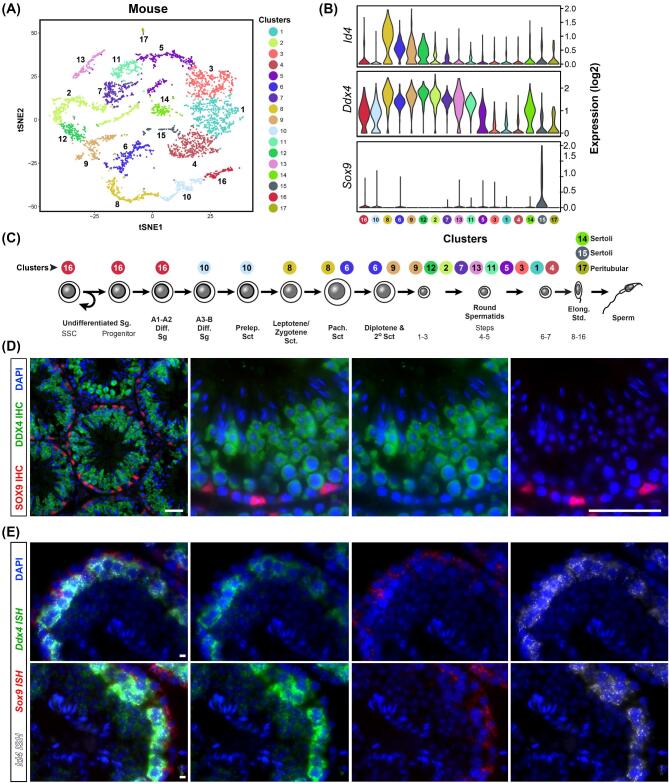
Figure 2.
Validation methods of scRNA-seq. (A) tSNE projection of scRNA-seq data from unselected adult mouse spermatogenic cells (from Hermann et al., 2018). Unbiased clusters indicate cell populations with significantly distinct transcriptomes. (B) Violin plots show expression of three key marker genes, Id4 (marks a subset of undifferentiated spermatogonia and many spermatocytes), Ddx4 (germ cell marker—expressed at low levels in spermatogonia and relatively higher levels in spermatocytes & spermatids), and Sox9 (Sertoli cell marker). (C) Spermatogenesis lineage diagram showing alignment of cell clusters with known cell types (from Hermann et al., 2018) (D) Adult mouse testis sections immunostained for SOX9 (red) and DDX4 (green) counterstained with DAPI (blue). Scale bar = 50μm. (E) smFISH triple-labeling using the RNAScope approach and adult mouse testis sections for Id4 mRNA (white), Sox9 mRNA (red), Ddx4 mRNA (green) and counterstained with DAPI. Scale bar = 5 μm. A, B and C are reprinted and adapted from Cell Reports 25(6) Hermann et al., “The Mammalian Spermatogenesis Single-Cell Transcriptome, from Spermatogonial Stem Cells to Spermatids,” pages 1650–1667.e8, Copyright 2018, with permission from Elsevier. This figure is available in color at Biology of Reproduction online.

