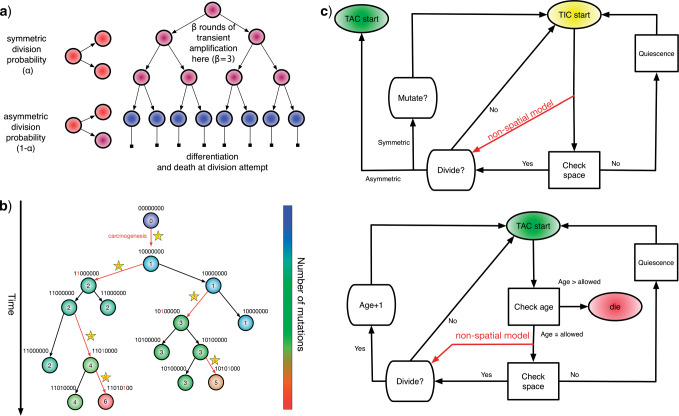
Figure 1.
Spatial stochastic model schematic with neutral mutation schema. a) The proliferative hierarchy. Each TIC can divide symmetrically with probability  to make two identical TIC progeny, or asymmetrically with probability
  to make one TIC and one TAC. TACs divide symmetrically until they reach a specific divisional age (
 for this work), after which they die upon division attempt. b) At each division event (branching) after the first (carcinogenesis, labeled with a
  ), a random number of mutations drawn from a Poisson distribution with expectation
  is conferred on each daughter (subsequent starred events). Each mutation event is given a unique flag, which is inherited by its offspring unless they too mutate. Each unique mutation can then be considered as a novel mutant allele (red) appearing in the population. c) Flowchart outlining CA rules governing TIC and TAC growth, including spatial inhibition of growth and TAC age.

