Figure 2.
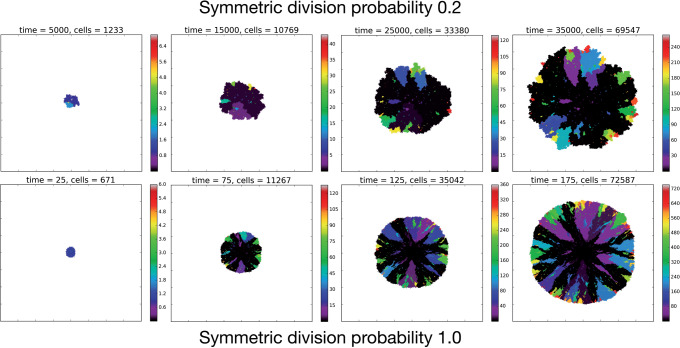
Temporal evolution of the spatial model reveals observable morphologic differences between TIC-driven and non-TIC-driven tumors, as observed by others. We plot representative results of simulations of two tumors, each simulated on a square lattice of size  . Top: a tumor simulated with
  and
and  . We notice, as have Enderling et al. (2009) and Sottoriva et al. (2010), a “patchy” clonal architecture, and nonuniform edge. Bottom: a tumor simulated with
  , that is, no proliferative hierarchy. We note smooth edges, radial patterns of clonal architecture, and relatively faster population growth, reaching
  70,000 cells in less than
  time steps. To reach a similar size, the tumor with symmetric division probability of
  took 35,000 time steps. Color bars denote number of mutations present in a given clone, note that the top scale is about 1/3 of bottom scale.

