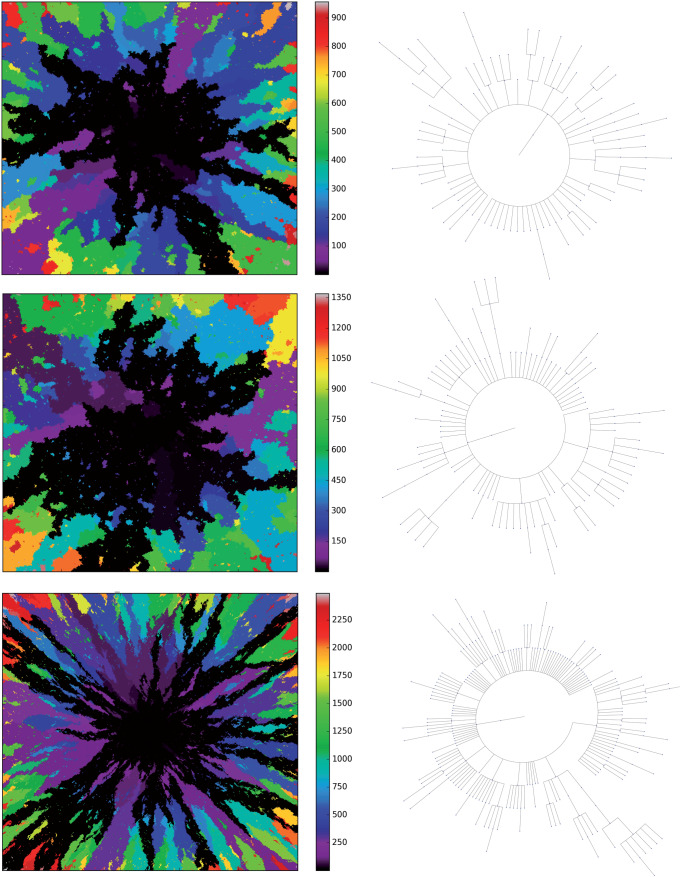
Figure 3.
Three example simulations with increasing symmetric division probability,  (0.2, 0.6, and 1.0 from top to bottom) and their associated phylogenetic trees. Each example plot is the result of a single stochastic simulation of our spatial CA model. Each simulation is initiated with a single TIC and complete when the domain is full, in this case 250,000 cells. Parameter values are
  and
and  . Visualized trees (right) have been pruned of all leaves for ease of visualization, which does not qualitatively affect measure rank (see Fig. 8).

