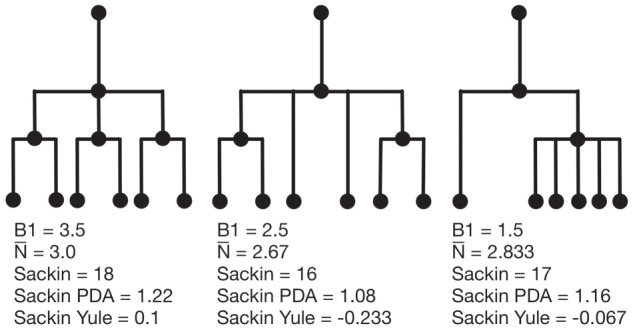
Figure 4.

Example phylogenetic trees and their measures. From left to right the trees contain  ,
,  and
and  internal nodes (dots) respectively, but the same number (
 ) of terminal nodes.

Example phylogenetic trees and their measures. From left to right the trees contain  ,
,  and
and  internal nodes (dots) respectively, but the same number (
 ) of terminal nodes.