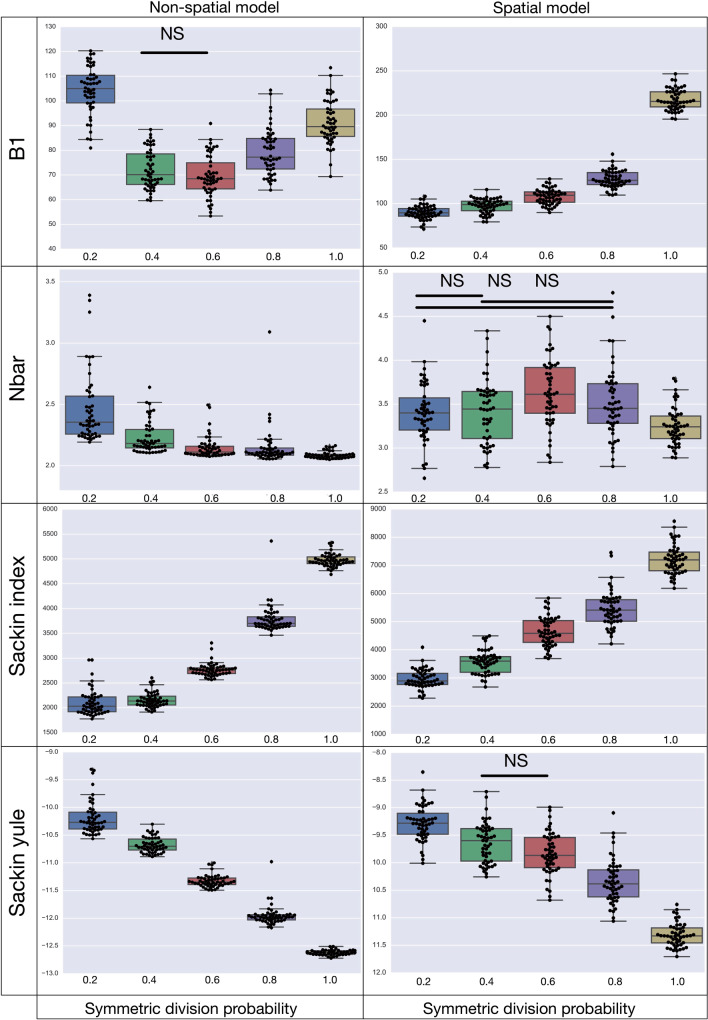
Figure 5.
A summary of four tree indices measured over a range of symmetric division probability. We plot the distribution of each of four measures of tree balance for the final resultant trees from  simulations against symmetric division probability. All simulations were run with
  and
and  until a tumor size of 250,000 cells was reached. In each plot, we display a box-whisker plot as well as the individual results as points. NS = nonsignificant by the Wilcoxon rank sum test.

